* Member, American Meteorological Society
Graphical Climatology of Dallas / Ft Worth: Daily Temperatures and Rainfall, by Year (1948 – Present)
 The following is a graphical climatology of Dallas-Fort Worth Int’l Airport Temperatures, precipitation, and various other variables, from 1948 into the present year 2025. Presented are daily climatological overview charts (temperature), annual time-series (temperature and precipitation), “climograms” (hour-by-month depictions of temperature, humidity, winds, fog, blowing sand/dust, and thunderstorms), followed by year-to-year graphs that depict daily max/min temperature, daily mean temperature anomalies, and daily rainfall, . Data were obtained courtesy of the Utah Climate Center and the NWS-Dallas/Fort Worth online site.
Latest Update: 30 Jun 2025 e-mail contact: cjfisk@att.net
CLIMATE OVERVIEW GRAPHS
2025 Daily Temperature/Precipitation Graph for DFW – New (6/30/25)
2024 Daily Temperature/Precipitation Graph for DFW –
2023 Daily Temperature/Precipitation Graph for DFW
2022 Daily Temperature/Precipitation Graph for DFW
2021 Daily Temperature/Precipitation Graph for DFW
2020 Daily Temperature/Precipitation Graph for DFW
2019 Daily Temperature/Precipitation Graph for DFW
2018 Daily Temperature/Precipitation Graph for DFW
2017 Daily Temperature/Precipitation Graph for DFW
– HISTORICAL SERIES –
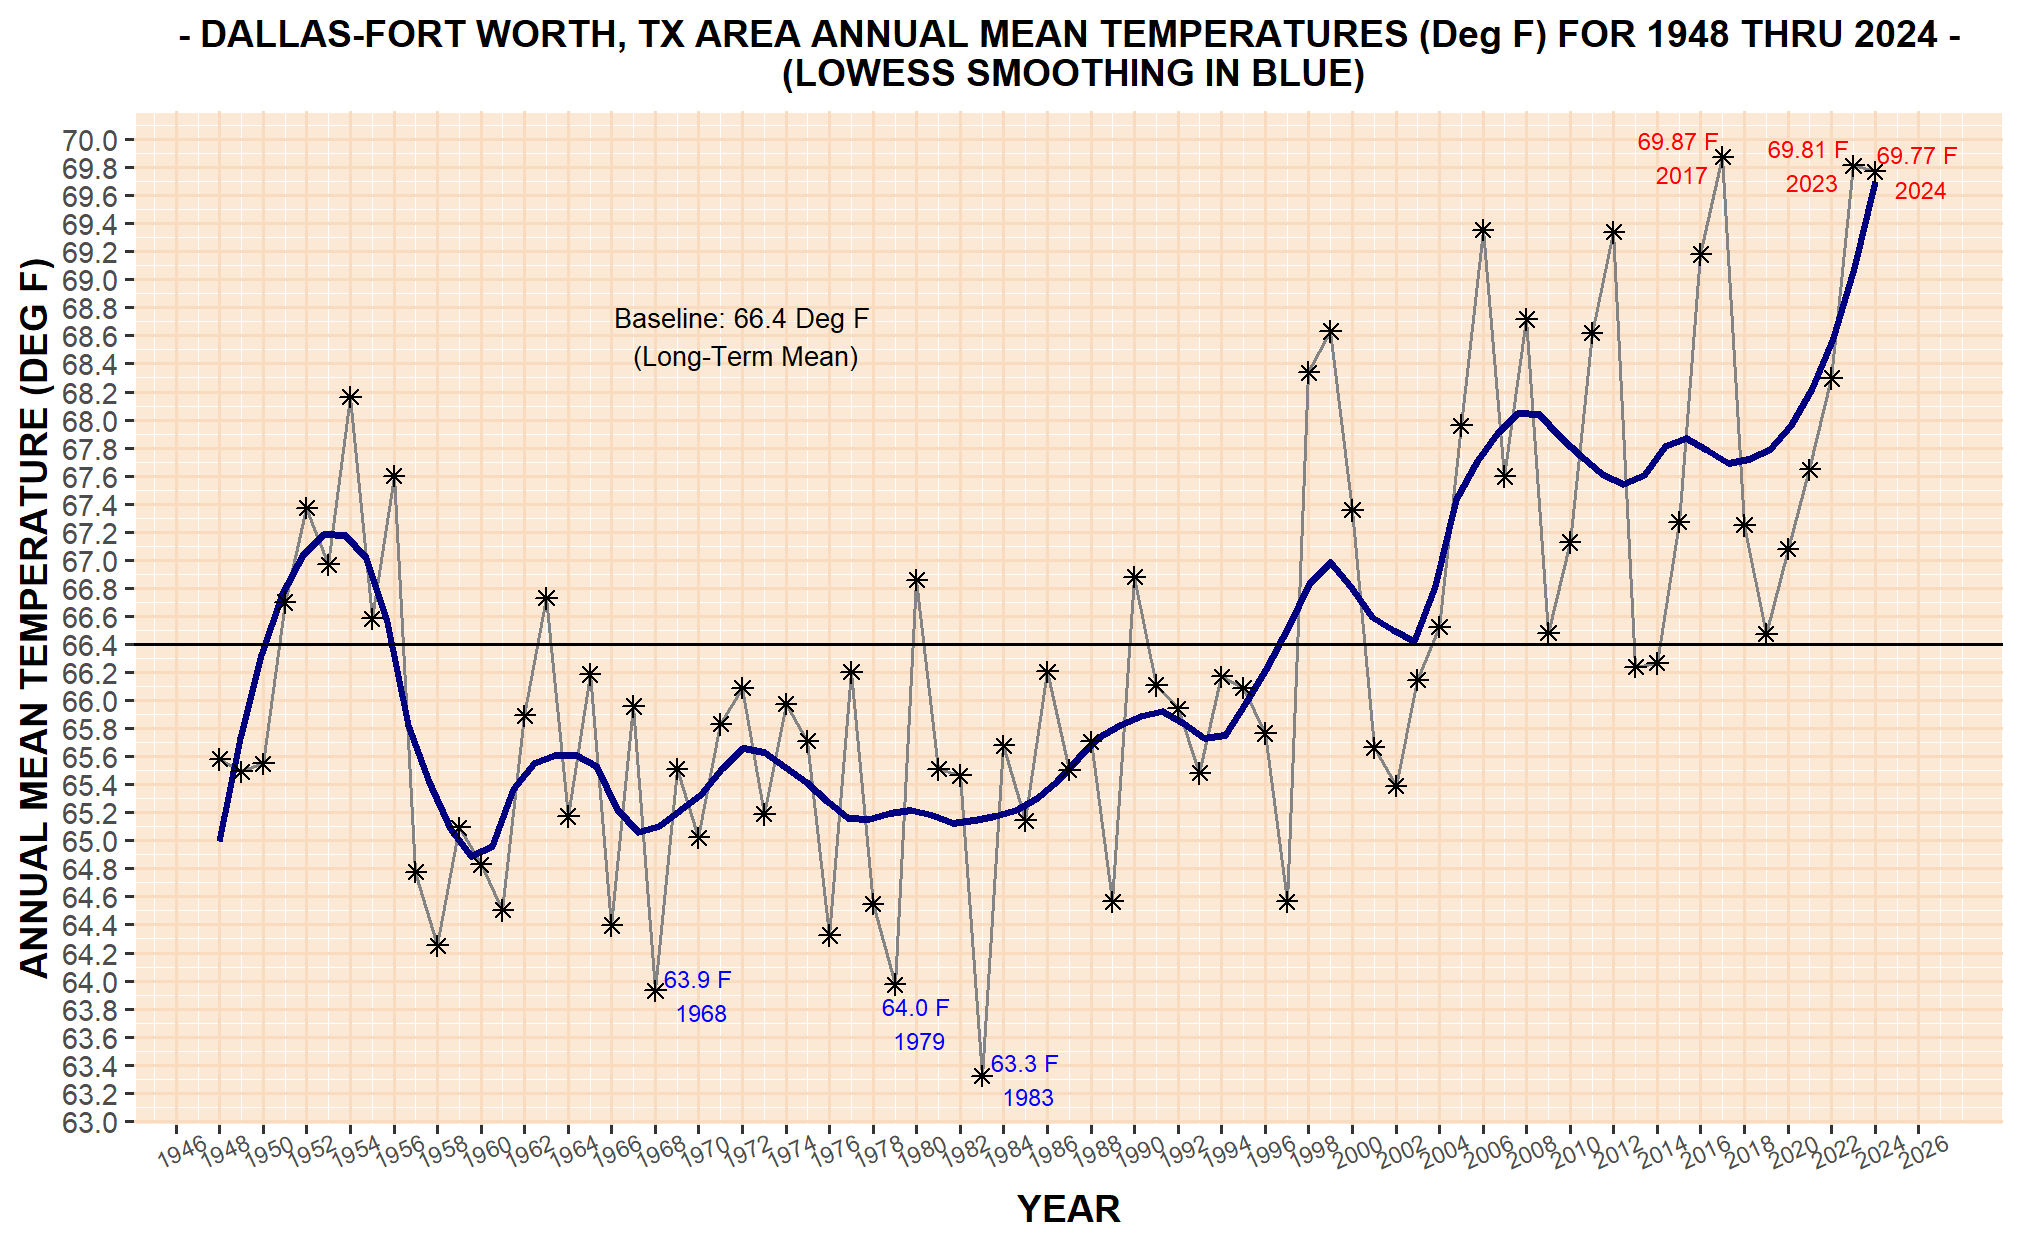
- DFW Annual Mean Temperature History (1948-2024) New (1/6/25)
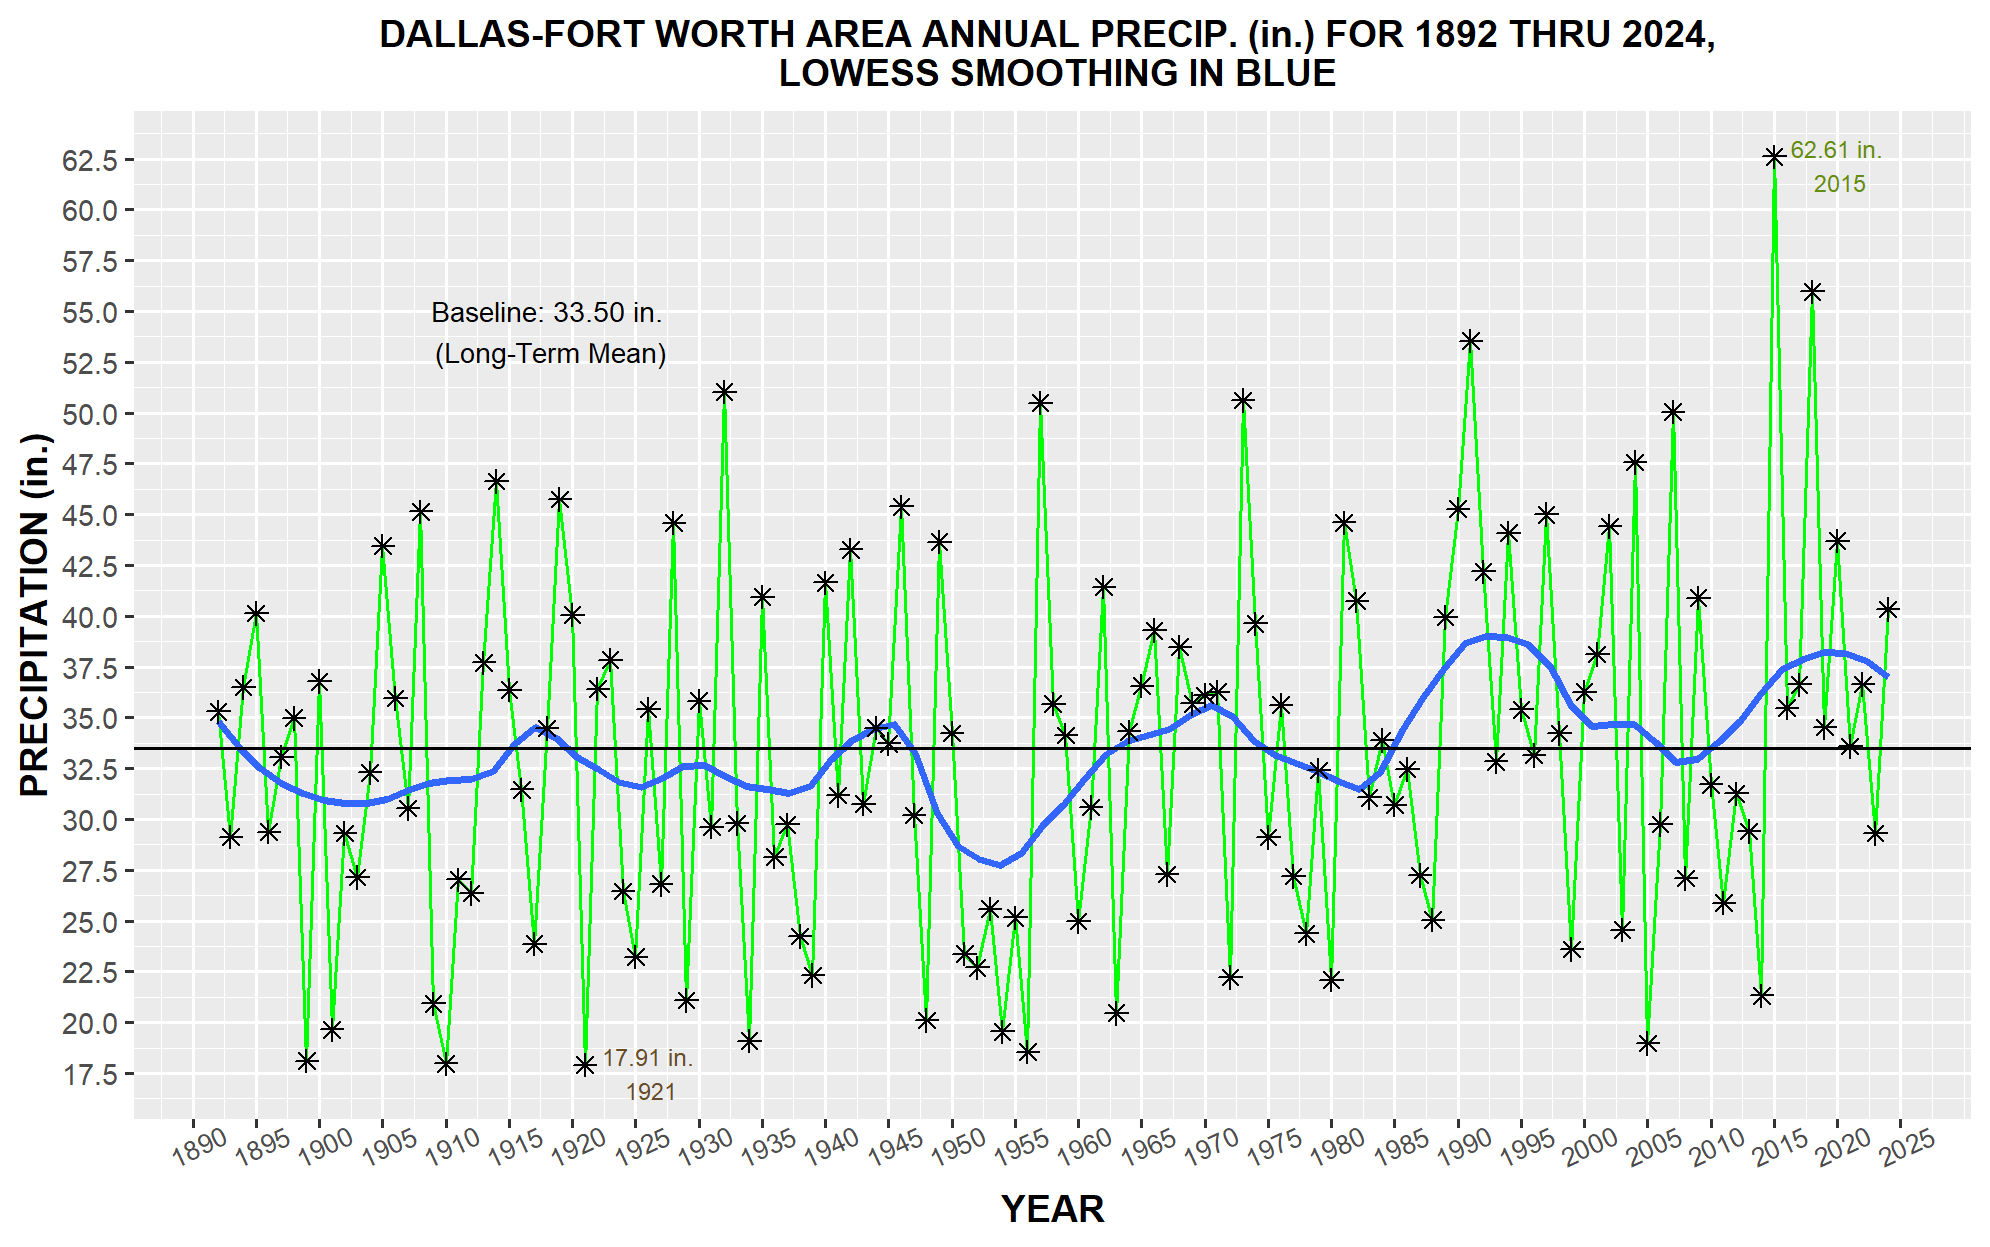
- DFW Calendar Year Precipitation History (1892-2024) New (2/21/25)
- Boxplot of DFW Monthly Precipitation Distributions (1899-2021)
- DFW Annual Maximum Temps (1948-2020)
- DFW Annual Minimum Temps (1948-2021)
- DFW Coldest Wind Chill Temps, by Year (1946-2023)
- DFW Warmest Heat Index Temps, by Year (1946-2023)
- DFW Pct. Frequencies of >=0.01 in., >=0.10 in., >= 0.25 in, >=0.50 and >=1.00 in. Rainfall Days, by Calendar Day (1948-2022)
HOUR-BY-MONTH CLIMOGRAMS FOR DALLAS-FORT WORTH
- Mean Hourly Temperatures
- Upper 99th Percentile Threshold Hourly Temps
- Lower 1st Percentile Threshold Hourly Temps
- Mean & Extreme Hourly Relative Humidities
- Mean Vector (Resultant) Winds
- Mean Scalar(Sustained) Wind Speeds
- Upper 99th Percentile Sustained Wind Speeds
OTHER SUMMARY CLIMATE CHARTS:
- DFW Average Daily Temperature Range, by Calendar Day
- DFW Average Day-to-Day Variability in Max, & Min Temperatures, by Calendar Day
YEAR-TO-YEAR GRAPHS – INTERPRETATION
The top chart for a given year’s page (accessed by the links below) are “floating-bars” of the year’s daily maxima and minima temperatures. Superimposed on the bars are two line traces, the upper one connecting long-term (1948-2020) mean daily maxima, the lower one mean daily minima.
Second chart down depicts the day-to-day mean temperature anomalies (daily mean temperature less the corresponding long-term 1948-2020 climatological mean). Departures extending upward in red from the zero line indicate warmer than average means for the day, those extending downward in blue indicate below average ones. Greatest single-day departure of either sign is -42 F on 15 Feb 2021 (daily temperature range: 14 F/4 F), the second-most, -40 F, on the very next day 16 February (daily temperature range: 18 F/-2 F )
(Note: Clicking on the floating-bar charts a second time after they appear on the screen will enlarge them further).
YEAR-TO-YEAR GRAPHS – COMPLETE SET OF LINKS
1948 1949 1950 1951 1952 1953 1954 1955 1956 1957 1958 1959 1960 1961 1962 1963 1964 1965 1966 1967 1968 1969 1970 1971 1972 1973 1974 1975 1976 1977 1978 1979 1980 1981 1982 1983 1984 1985 1986 1987 1988 1989 1990 1991 1992 1993 1994 1995 1996 1997 1998 1999 2000 2001 2002 2003 2004 2005 2006 2007 2008 2009 2010 2011 2012 2013 2014 2015 2016 2017 2018 2019 2020
The third chart down shows the second chart’s daily mean temperature anomalies in deseasonalized (“standardized” or “z-scores”) form . Those of plus or minus 3.0 z are the “extremes of the extremes”, comprising just 0.23% (or 63 individual days’ cases) over the entire DFW history. All but two of these are negatively signed. Greatest positive standardized departure is +3.12 z for 25 Dec 2016 (80 F/69 F daily temperature range), the greatest negative –4.03 z for 24 Aug 1966 (72 F/64 F temperature range, a day with 1.64″ rain ).
The bottom chart depicts daily precipitation totals, as high as 5.85 inches (24 Sept 2018).
LINKS TO SOME OF THE MORE INTERESTING YEAR-TO-YEAR GRAPHS, WITH ACCOMPANYING NOTES
The links below depict daily temperature and precipitation patterns for years that were eventful in some way: individual day, months, and annual basis extremes, along with patterns which are just interesting to look at for their own sake. Dallas- Fort Worth is noteworthy for its great variability in temperature progressions, especially over the non-summer months, and many of the charts linked below, not to mention others not in the list, have visually striking patterns.
- 2018 – Second wettest year in history (55.97″). September and October combined with 28.35″.
- 2017 – Annual Mean (69.9 F) surpasses 2006 by 0.5 F for warmest year to date.
- 2015 – Wettest Year to date (62.61″). May records 16.96″, most for any calendar month in history.
- 2011 – August (93.4 F) warmest calendar month in history. Warmest Summer (90.5 F).
- 2006 – Warmest year to date (69.4 F).
- 2005 – Driest year (18.97″) since 1956.
- 1999 – Surpasses last year as warmest year to date (68.6 F)
- 1998 – Surpasses 1954 by 0.1 F as warmest year to date (68.3 F).
- 1996 – Great day-to-day variability in daily max temps over Jan & Feb. Mean figure (10.2 F) – highest for any two-month adjacent segment in history.
- 1989 – Minus 1 F on 23 December.
- 1983 – Coldest year in history (63,3 F). Very cold December (34.9 F – 3.8 standard deviations below average).
- 1982 – Striking daily mean temperature departure pattern over course of year.
- 1980 – Warmest Summer up to this time (89.2 F). Max temps of 113 F and 112 F – highest in history down to the present.
- 1978 – January (33.8 F) & February (36.7 F) each the coldest months of their name of the 1948-present history. Three coldest Januarys in DFW history, 1948-present, occurred in this year, 1977 and 1979.
- 1959 – January average day-to-day variability in daily max temperature (13.1 F) highest of any individual calendar month in history.
- 1956 – Driest year (18.55″) of 1948-present history.
- 1954 – In midst of six year 1951-56 drought, warmest year (68.2 F) until 1998.
- 1950 – Average day-to-day variability in daily maximum temperature (7.0 F), highest of any year (1948-present)
- 1949 – Minus 2 on 31 January.