Graphical Climatology of Downtown San Francisco: Daily Temperatures and Rainfall, by Year (1875 – Present)
")
The following is a graphical climatology of Downtown San Francisco, California temperatures and precipitation, from 1875 into the current year 2025. Included are summary overview charts followed by 151 year-to-year graphs depicting daily temperatures, temperature anomalies, and precipitation. The 1875 to 2025 period of record includes observations from four different Downtown locations. Current year’s data can be accessed from the NWS-Monterey website at http://www.wrh.noaa.gov/mtr/
Latest Update: 2 Jul 2025 e-mail contact: cjfisk@att.net
CLIMATE OVERVIEW GRAPHS
2025 Daily Temperature and Precipitation for Downtown San Francisco New (6/30/25)
2024 Daily Temperature and Precipitations for Downtown San Francisco
2024-2025 Cumulative Daily Precipitation for Downtown San Francisco New (6/30/25)
2023 Daily Temperature and Precipitations for Downtown San Francisco
2022 Daily Temperatures and Precipitation for Downtown San Francisco
2021 Daily Temperatures and Precipitation for Downtown San Francisco
2020 Daily Temperatures and Precipitation for Downtown San Francisco
2019 Daily Temperatures and Precipitation for Downtown San Francisco
2018 Daily Temperatures and Precipitation for Downtown San Francisco
SAN FRANCISCO MEAN AND RECORD DAILY MAX/MIN TEMPERATURES
SAN FRANCISCO RAINFALL
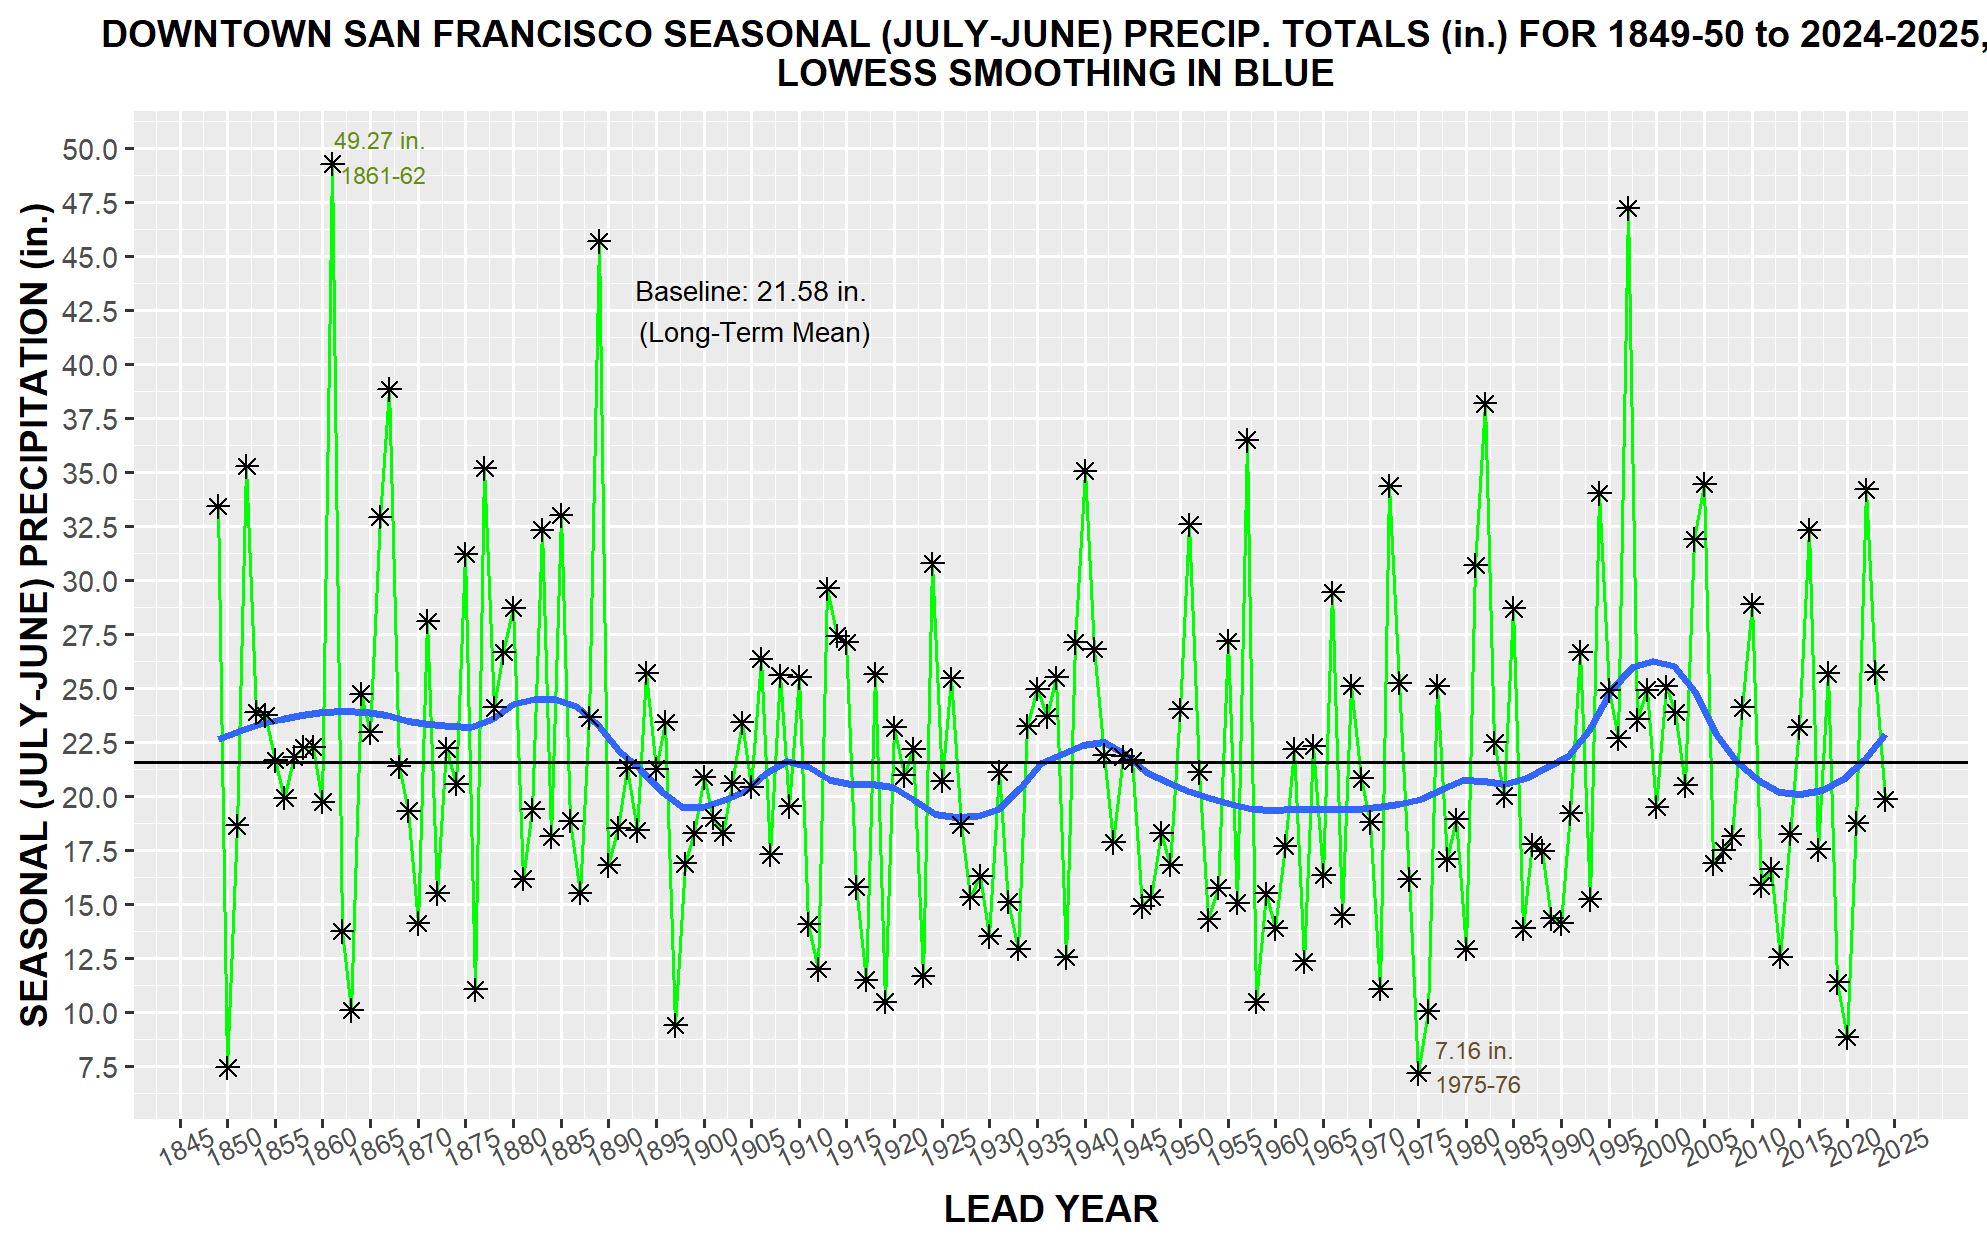
- Downtown San Francisco Seasonal Rainfall (1849-50 thru 2024-25 Seasons) New (7/2/25)
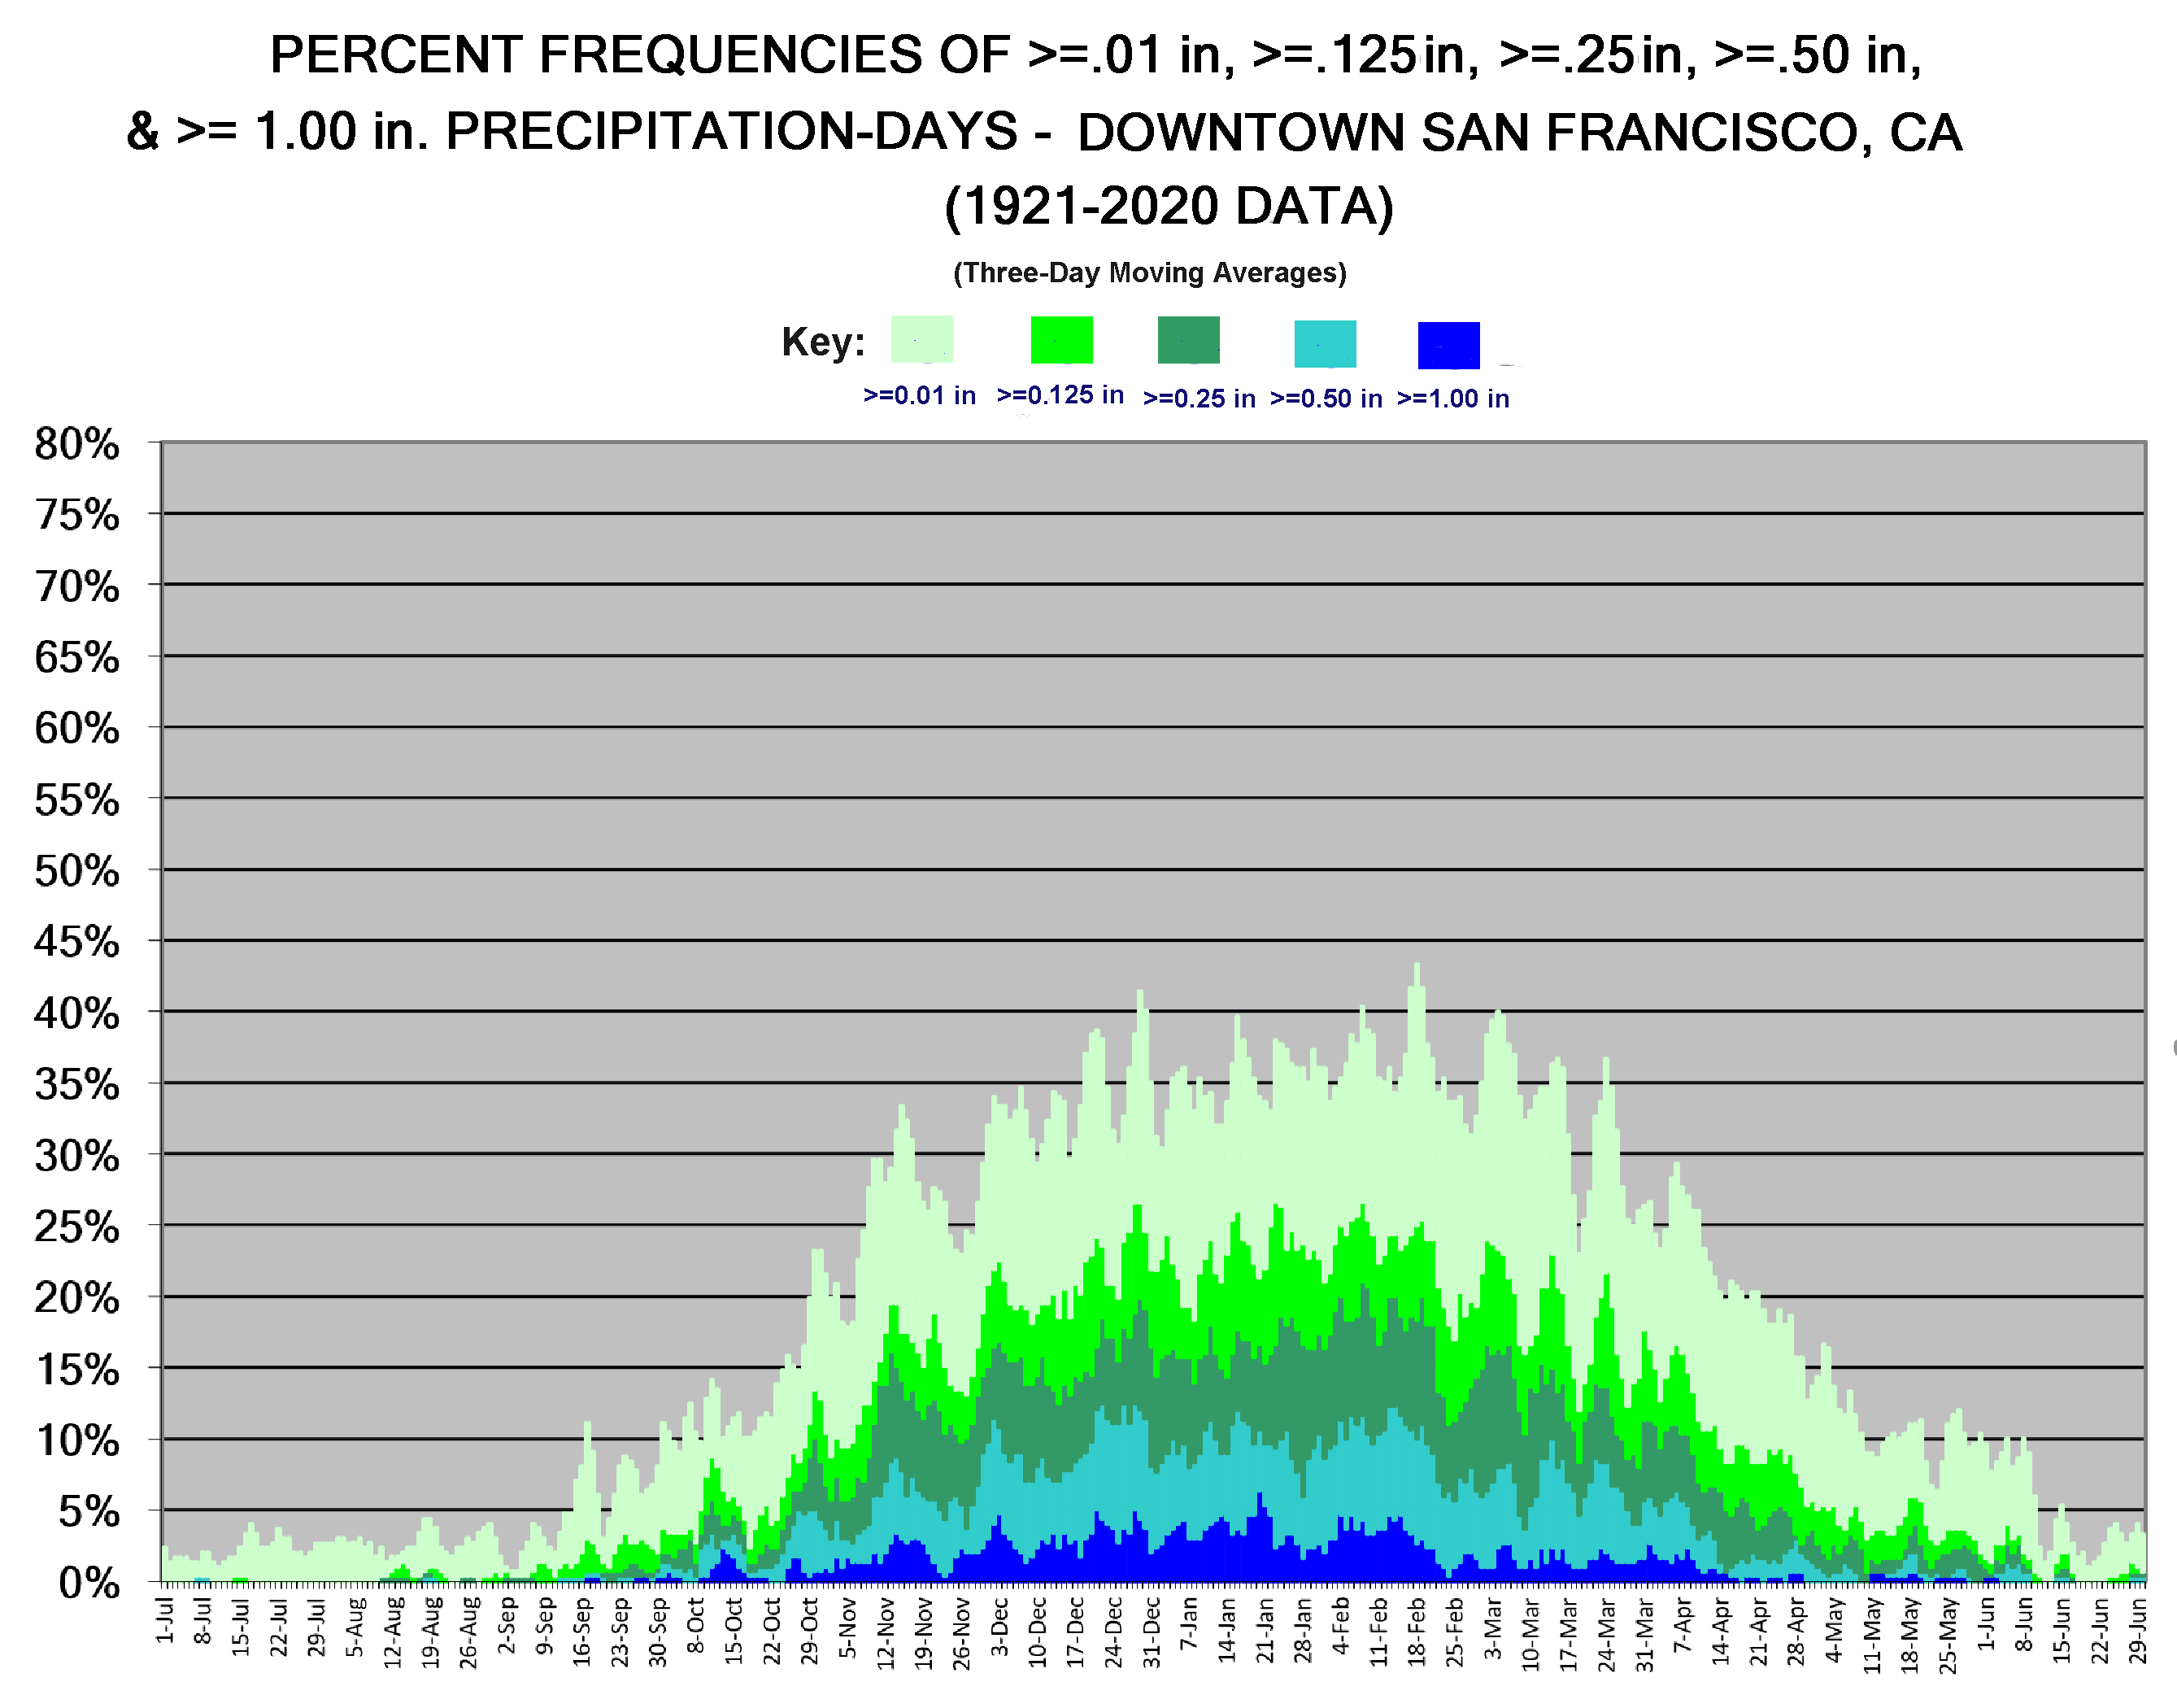
- Downtown San Francisco Measurable Precipitation Days (1849-50 thru 2022-2023 Seasons) (10/4/23)
- Boxplot of Downtown San Francisco Monthly Precipitation Distributions (1849-50 thru 2016-17 Seasons
OTHER SUMMARY CLIMATE GRAPHS:
CLIMOGRAMS FOR SAN FRANCISCO INT’L AIRPORT & OTHER CHARTS
- Mean and Extreme Hourly Humidities (Lower 1st Pctile)
- Mean and Extreme Hourly Temps (Upper 99th & Lower 1st Pctile)
- Annual Coldest Wind Chill Temperatures (1948-2023) New (9/5/23)
- Annual Warmest Heat Index Temperatures (1948-2023) New (9/5/23)
- Mean and Extreme Hourly Wind Speeds (Upper 99th Pctile)
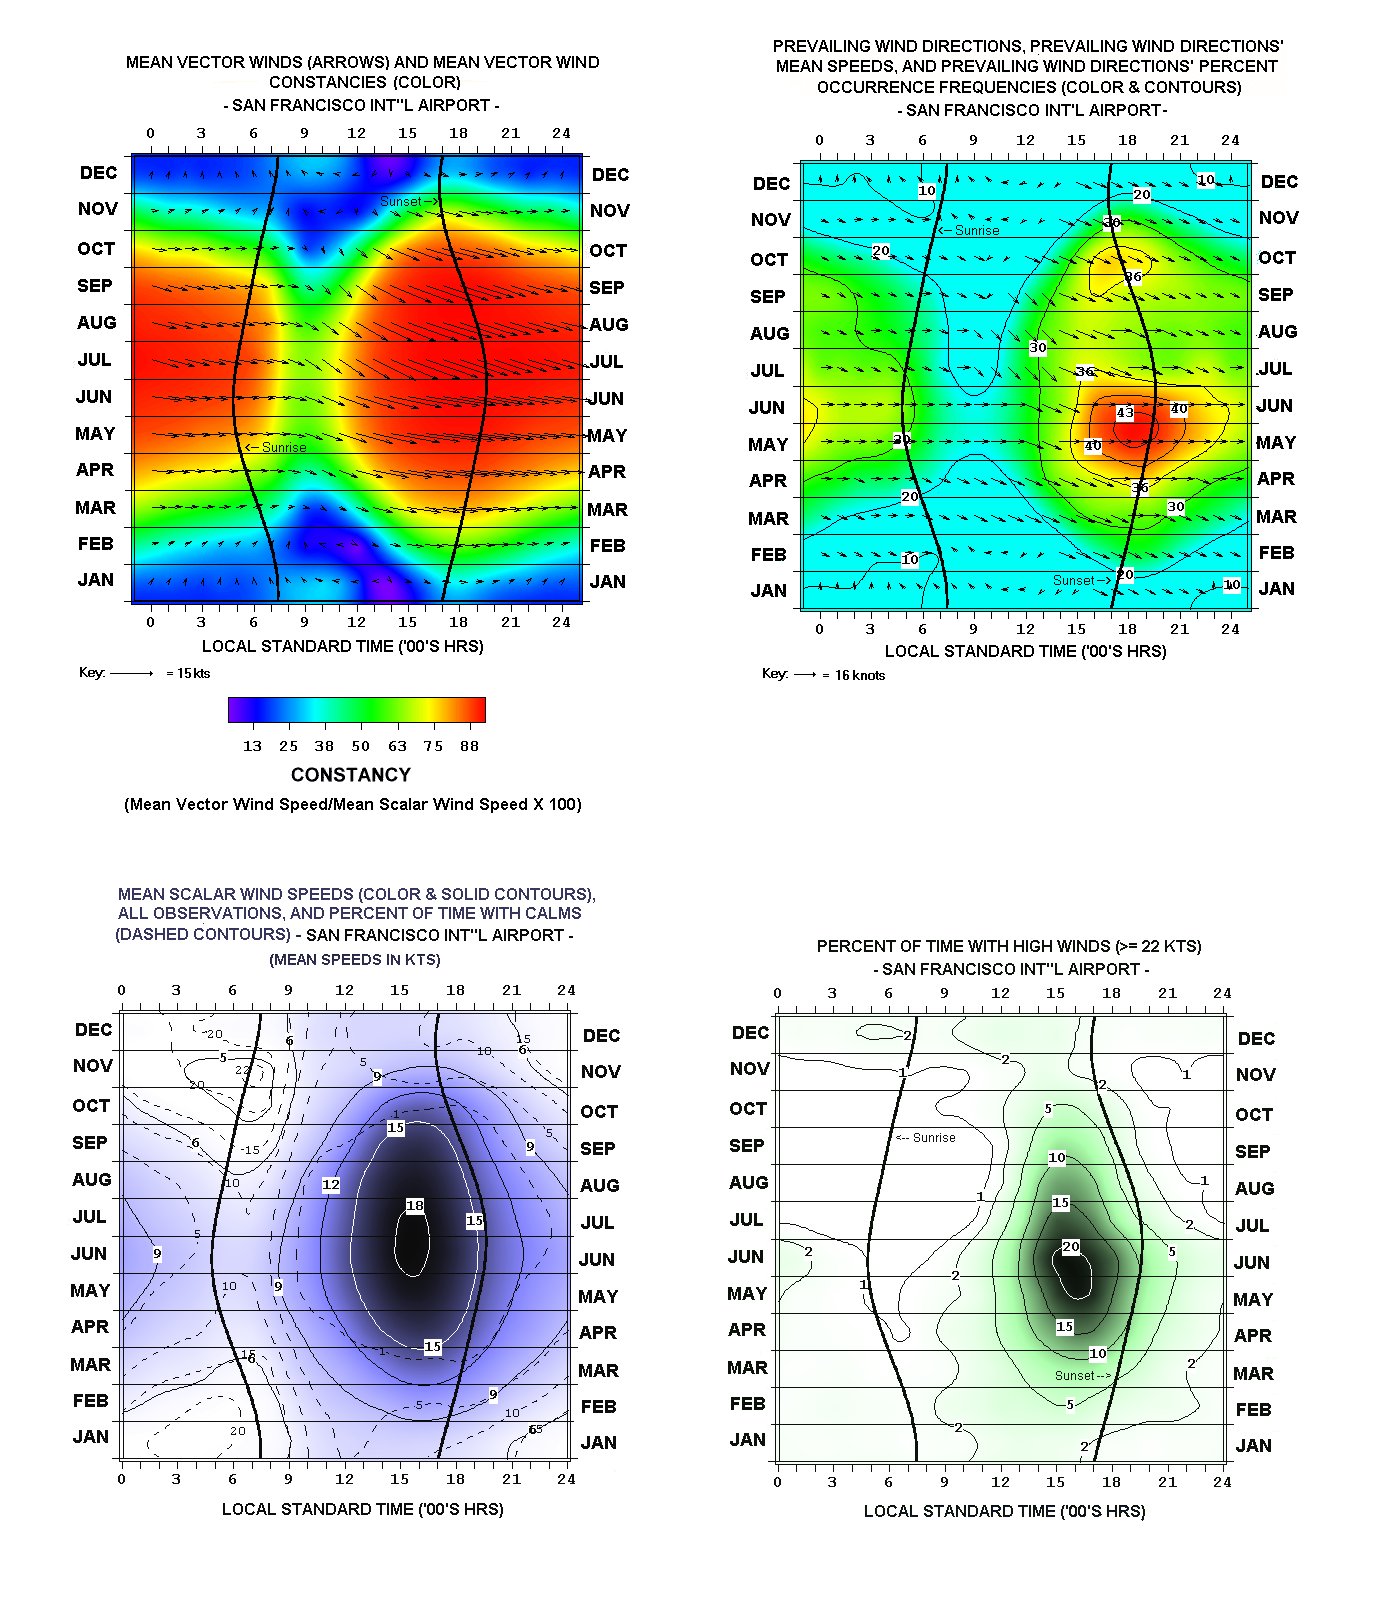
- K-Means Clustering Analysis of SF Int’l Airport Diurnal Resultant Wind Patterns
YEAR-TO-YEAR GRAPHS – INTERPRETATION
The uppermost chart for a given year’s page (accessed by the links below) are “floating-bars” of the year’s daily maxima and minima temperatures. Superimposed on the bars are two line traces, the upper one connecting 1875 to present mean daily maxima, the lower one mean daily minima. The bars depict the varying diurnal, synoptic, long-wave, seasonal, and sea-surface temperature influences on San Francisco temperature over time, and for effect they are deliberately adjoined with no spaces in-between, creating a sort of “signature” look. The same is repeated for the two anomaly charts further down.
The second chart down shows the day-to-day mean temperature anomalies (daily mean temperature less the day’s respective long-term climatological mean). Vertical lines extending upward from the zero line indicate above average means for the day (colored red), downward ones depicting below average ones (colored blue). In general, the most extreme departures are “positive”, typically reflecting abbreviated offshore flow events, visualized as upward red “spikes”.
The third chart down shows the second chart’s anomalies in deseasonalized (“standardized”) form or “z-scores” (also alternatively, “sigma”). Daily scores of plus or minus 3.0 occur just 1.9% of the time; nearly all of these (96%) positively signed, reflecting the extreme warming offshore flow events described above. Magnitudes can reach spectacularly high positive magnitudes, well above 3.0 z. Greatest positive in the record is +6.0 z for 17 July 1988, greatest negative –5.1 z for 11 December 1932.
The bottom chart depicts daily precipitation totals, as high as 5.54 inches (5 November 1994).
(Note: Clicking on the floating-bar charts a second time after they appear on the screen will enlarge them even further).
YEAR-TO-YEAR GRAPHS – COMPLETE SET OF YEARS’ LINKS
1875 1876 1877 1878 1879 1880 1881 1882 1883 1884 1885 1886 1887 1888 1889 1890 1891 1892 1893 1894 1895 1896 1897 1898 1899 1900 1901 1902 1903 1904 1905 1906 1907 1908 1909 1910 1911 1912 1913 1914 1915 1916 1917 1918 1919 1920 1921 1922 1923 1924 1925 1926 1927 1928 1929 1930 1931 1932 1933 1934 1935 1936 1937 1938 1939 1940 1941 1942 1943 1944 1945 1946 1947 1948 1949 1950 1951 1952 1953 1954 1955 1956 1957 1958 1959 1960 1961 1962 1963 1964 1965 1966 1967 1968 1969 1970 1971 1972 1973 1974 1975 1976 1977 1978 1979 1980 1981 1982 1983 1984 1985 1986 1987 1988 1989 1990 1991 1992 1993 1994 1995 1996 1997 1998 1999 2000 2001 2002 2003 2004 2005 2006 2007 2008 2009 2010 2011 2012 2013 2014 2015 2016 2017 2018 2019 2020
LINKS TO YEARLY GRAPHS OF PARTICULAR INTEREST, WITH ACCOMPANYING NOTES
- 1877 Five-day “spike” of warm offshore flow in early June. Daily max temps all surpass 85 F.
- 1883 – An otherwise cool year punctuated by several-day offshore flow events
- 1884 – Wettest (38.13″) calendar year until 1983. Heavy Rains as late as June.
- 1888 – 29 F on both 14-15 January, coldest daily minima until December 1932.
- 1899 – Gyrating early year temperature spells.
- 1901 – Long stretch of below average temps, mid-March thru September
- 1904 – First recorded 100+ F temperatures – 100 F and 101 F, respectively. on 7-8 September.
- 1905 – July 7th 5.8 standard deviations above the long-term daily average (daily range: 98 F/66 F)
- 1911 – Coolest year down to the present.
- 1916 and 1917 – Unusual mix of both above and below normal temperature spells for each year.
- 1926 – As influenced by a strong El Nino, warmest March, April, and May since the start of the official mean monthly history (in 1871). Also warmest year to date.
- 1931 – Steady above normal warmth over first half of year. Second warmest year to date
- 1932 – Sharp December cold snap over the 8th-14th. Coldest week-long period (38.9 F) of the 1875 to present era. Max/min temperature only 35/27 F on the 11th.
- 1937 – Coldest January in all history. First 52 days of the year each below average in mean temperature. .
- 1938 – Nineteen consecutive measurable rain-days over late January to mid-February.
- 1939 – Warmest September on record up to this time, the 17th to 23rd the warmest week-long period (79.3 F) in all history down to present.
1940-41 – Strong El Nino episode. Wettest July-June water year (35.05”) since 1889-90.
1949 – Very cool January and February help produce coldest winter in all history (Dec. ’48 – Feb ’49). - 1951– Coolest Summer (Jun.-Aug.) since 1911 and coolest Summer through the present.
1957-58– Strong El Nino. Wettest July-June water year (36.48”) since 1889-90.
1962 – Second wettest October (5.51”) in history. Rainstorms interrupt 1962 World Series.
1967 – Irregular anomaly pattern in temperature and rainfall over course of year. Coldest April in all history.
1970 – Another highly irregular temperature anomaly pattern over course of the year – Mix of short and long-term warm/cold spells.
1971 – In an otherwise cool year, hot Sepember day in Downtown San Francisco history (101 F/ 72 F) on 14th. - 1975-76 – Driest rain year (July-June) in all history (7.16”).
- 1976-77 – A second droughty rain year in a row. Fourth driest in history (10.02”). Two-year rain deficit about 25”.
- 1982-83 –Great El Nino. Water year precipitation (38.17”) most since 1889-90.
- 1983 – Annual mean temperature ties 1934 for warmest in history up to this time. Eight of the next fifteen years including 1983, equal to or warmer than 1934. Wettest March (9.04”) and warmest Summer up to this time.
- 1984 – September warmest calendar month in all history (69.4 F).
- 1986 – Warmest January and February in all history, third warmest March. Warmest year to date by 1.2 F
- 1988 – 103 F on 17 July; highest temperature yet recorded in Downtown San Francisco.
- 1989 – Five-day mid-summer-like spell in early April.
- 1990 – Intense cold spell in late December, but 1990 still ties 1934 and 1983 as warmest in history. Highest average daily temperature range (15.7 F) of 1875-present period.
- 1992 – Warmest year in all history (60.8 F). Also warmest Spring and Fall
- 1993 –Warmest Summer in all history.
- 1994 – Coldest and 2nd wettest November (11.49”) in all history.
- 1995 – Warmest July in all history.
- 1997-98 – The other great El Nino of the 20th century. Wettest rain year (47.22”) since 1861-62, second wettest in all history. Wettest February (14.89”) in history.
- 1999 – La Nina year. Coolest year since 1975 and coolest Spring since 1911.
- 2000 – 103 F on 14 June, ties July 1988 mark for highest temperature yet recorded in Downtown San Francisco.
- 2013 – Driest calendar year in history (6.18″).
- 2017 – 106 F on 1 September highest temperature ever recorded in Downtown SF.
* Member, American Meteorological Society2