Graphical Climatology of Downtown San Diego: Daily Temperatures and Rainfall, by Year (1875 – Present)
")
The following is a graphical climatology of San Diego, California temperatures and precipitation, from 1875 into 2024. Included are summary overview charts followed by 150 year-to-year graphs depicting daily temperatures, temperature anomalies, and precipitation. The 1875 to 2024 period of record includes observations from eight different but relatively nearby Weather Service Office locations downtown (through 1926) and three at Lindbergh Field (1927-present). The latter is about 1.5 miles to the northwest of Downtown, and about 30 feet lower in elevation (~ 15 feet msl). For the pre-Lindbergh Field era, thermometer placements ranged from 20 ft to 94 ft above ground level, those at Lindbergh Field form 6 to 37 feet above groundlevel.A small number of missing data, comprising 45 days, or ~.001 % of the record, were filled using observations from nearby Chula Vista. Data were accessed from the Utah Climate Center and NCDC Online sites, plus that of the NWS-San Diego site.
Last update: 13 Oct 2024 e-mail contact: cjfisk@att.net
CLIMATE OVERVIEW GRAPHS
2024 Daily Temperature and Precipitation for San Diego New (10/13/24)
San Diego Season-to-Date Rainfall for 2023-24 New (6/30/24)
2023 Daily Temperature and Precipitation for San Diego
2022 Daily Temperature and Precipitation for San Diego
2021 Daily Temperature and Precipitation for San Diego
2020 Daily Temperatures and Precipitation for San Diego
2019 Daily Temperature and Precipitation for San Diego
2018 Daily Temperature and Precipitation for San Diego
2014 Daily Temperatures and Precipitation for San Diego (Warmest in History)
SAN DIEGO MEAN AND RECORD DAILY MAX/MIN TEMPERATURES BY MONTH
SAN DIEGO MISC. RAINFALL & TEMPERATURE GRAPHS
- San Diego Measurable Precipitation-Day Counts, by Season (1875-76 thru 2022-23 Seasons)
- Coldest Wind Chill Temperatures, by Year (1948-2023)
- Warmest Heat Index Temperatures, by Year (1948-2023)
- San Diego Annual Temperature History (1850-2023) New (1/6/24)
- Box Plot of San Diego Historical Monthly Rainfall
CLIMOGRAMS FOR SAN DIEGO AND OTHER CHARTS:
- Mean & Extreme Temps (99% & 1% Percentile Levels)
- Mean & Extreme Rel Hum’s (1% Percentile Levels)
- Mean & Extreme (Sustained) Winds (99% Percentile Level)
- K-Means Cluster Analysis of San Diego Lindbergh Field Resultant Wind Patterns
- Record Warmest Max/Min Temperature Days, by Calendar Day (1875-2021)
Record Coldest Max/Min Temperature Days, by Calendar Day (1875-2021)
YEAR-TO-YEAR GRAPHS – INTERPRETATION
The uppermost chart for a given year’s page (accessed by the links below) are “floating-bars” of the year’s daily maxima and minima temperatures. Superimposed on the bars are two line traces, the upper one connecting 1875 to present mean daily maxima, the lower one mean daily minima. The bars depict the varying diurnal, synoptic, long-wave, seasonal, and sea-surface temperature anomaly influences on San Diego temperature over time, and they are deliberately adjoined with no spaces in-between, creating a sort of “signature” appearance.
The second chart down shows the day-to-day mean temperature anomalies (daily mean temperature less the corresponding long-term climatological mean). Vertical lines extending upward from the zero line indicate above average means for the day (colored red), those extending downward indicate below average daily means (colored blue). In general, the most extreme departures for San Diego are positive, reflecting to a large extent the occurrence of warming offshore flow episodes.
(Note: Clicking the floating-bar charts a second time after they appear on the screen will enlarge them even further).
YEAR-TO-YEAR GRAPHS – COMPLETE SET OF LINKS
1875 1876 1877 1878 1879 1880 1881 1882 1883 1884 1885 1886 1887 1888 1889 1890 1891 1892 1893 1894 1895 1896 1897 1898 1899 1900 1901 1902 1903 1904 1905 1906 1907 1908 1909 1910 1911 1912 1913 1914 1915 1916 1917 1918 1919 1920 1921 1922 1923 1924 1925 1926 1927 1928 1929 1930 1931 1932 1933 1934 1935 1936 1937 1938 1939 1940 1941 1942 1943 1944 1945 1946 1947 1948 1949 1950 1951 1952 1953 1954 1955 1956 1957 1958 1959 1960 1961 1962 1963 1964 1965 1966 1967 1968 1969 1970 1971 1972 1973 1974 1975 1976 1977 1978 1979 1980 1981 1982 1983 1984 1985 1986 1987 1988 1989 1990 1991 1992 1993 1994 1995 1996 1997 1998 1999 2000 2001 2002 2003 2004 2005 2006 2007 2008 2009 2010 2011 2012 2013 2014 2015 2016 2017 2018 2019 2020
The third chart down shows the second chart’s anomalies in deseasonalized (“standardized”) form. Standarized stats or “z-scores” of plus or minus 3.0 occur just 0.8% of the time; nearly all of these (95%) positively signed, reflecting extreme warming offshore flow events and in some cases, positive sea-surface temperature anomalies. Greatest positive standardized departure in the record is the amazing +6.6z for 25 May 1896, greatest negative –4.2z for 6 January 1913.
The bottom chart depicts daily precipitation totals, as high as 3.23 inches (5 April 1926).
LINKS TO SOME OF THE MORE INTERESTING YEAR-TO-YEAR GRAPHS, WITH ACCOMPANYING NOTES
- 1876-77 – Driest rain year (3.75″) until 1960-61
- 1877 – In midst of usual “June-gloom” period, three successive 90 F days early in the month.
- 1878 – 100 F on 11 September..
- 1879 – In an otherwise cool year, abbreviated hot spells scattered throughout the year, especially 99 F on 29 March, warmest in history for March down to the present.
- 1880 – Second coolest year in San Diego history down to the present. Coolest March, July, August, and Fall (September-November).
- 1883 – Abrupt warming in late-May.
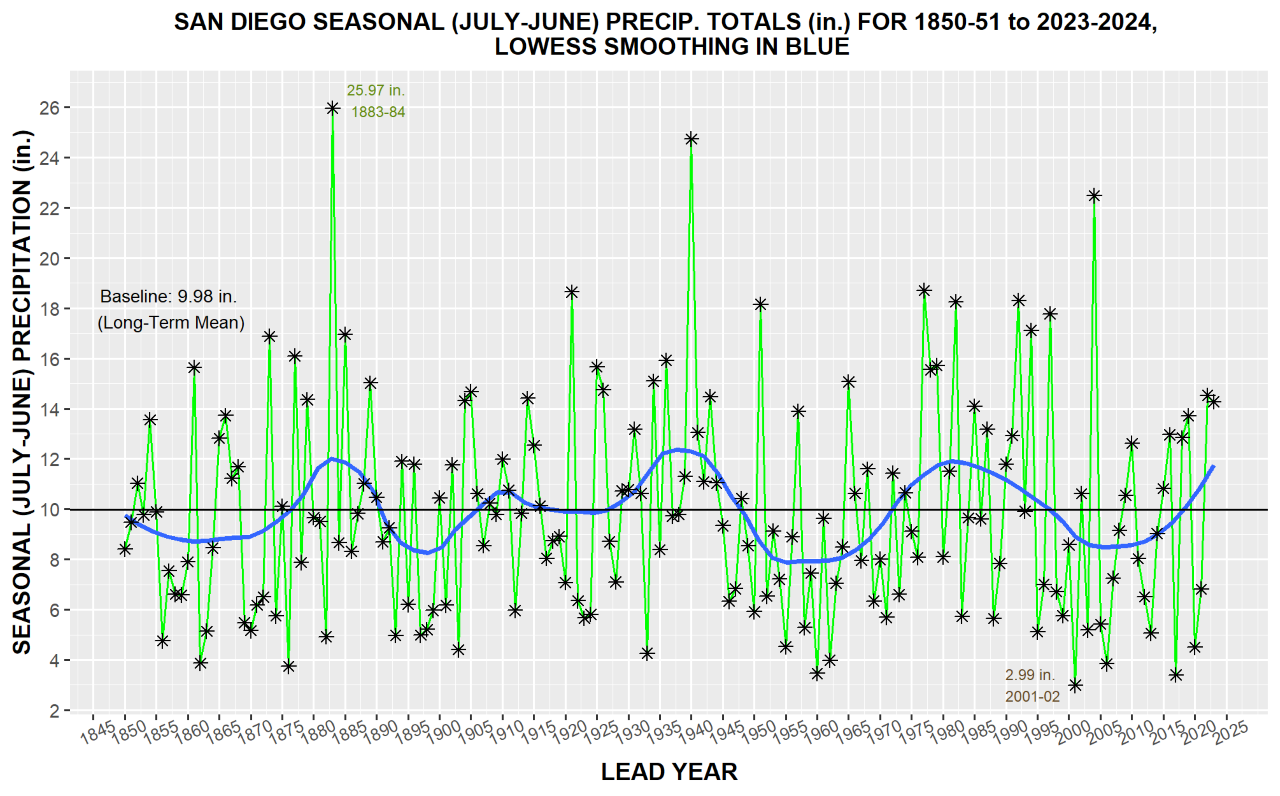
- 1883-84 – Wettest Rain Year (Jul-Jun) in all San Diego history (25.90″). Moderate El Nino possibly enhanced by effects of Krakatoa eruption. Wettest February in history (9.05″).
- 1886 – Coldest November in history.
- 1890 – Early June heat. Long Warm Spells in November and December.
- 1891 – In an otherwise cool year, very warm over August and early September.
- 1894 – Coolest year in San Diego history. Coolest January and calendar month (49.1 F) until January 1949. Also coolest Spring (March-May).
- 1896 – 98 F/70 F on 25 May, 6.5 standard deviations above average for the day. Highest temperature ever recorded in May down to present.
- 1899 – Coolest Summer in history (63.9 F).
- 1908 – Coolest May and June in history.
- 1913 – 25 F on 7 January coldest temperature ever recorded in San Diego; 110 F on 17 September the warmest until 1963.
- 1916 – Coolest Fall (September-November) in history.
- 1921 – Wettest May (2.54″) and wettest December (9.26″) in history.
- 1926 – Strong El Nino year. Wettest April in history (5.37″). Warmest year in the record up to this time.
- 1930 – 100 F on 30 July wamest temperature ever recorded in that calendar month.
- 1931 – Warmest year to date.
- 1933 – Coolest September in history.
- 1939 – Wettest September in history (2.58″), 106 F on 21 September.
- 1940-41 – Strong El Nino episode produces wettest rain year (24.74″) since 1883-84.
- 1949 – January coldest calendar month in history (47.8 F).
- 1953 – 88 F on 10 January warmest in all history for this calendar month.
- 1955 – 98 F on 30 August wamest temperature ever recorded in this calendar month; 104 F the next day, 1 September.
- 1958 – Warmest year to date.
- 1959 – Warmest year to date record broken after one year.
- 1960-61– Driest rain year in history (3.46″) up to this time.
- 1961 – 107 F on 14 October, warmest October reading in all history.
- 1963 – 111 F on 26 September highest temperature ever recorded in San Diego history.
- 1965 – Strong ’65-’66 El Nino brings early heavy rains. Wettest November in history (5.82″) and fourth wettest December (6.60″).
- 1966 – 97 F on 1 November sets high mark for that month.
- 1976 – Warmest year to date. Six of next nine years including ’76 all warmer than any previous ones in history. 97 F on 4 November ties high mark for that month. Warmest November in history.
- 1977 – Wettest August in history (2.13″), warmest December (63.2 F).
- 1978 – Warmest March in history; 5th wettest (5.00″).
- 1979 – Remarkable four-day hot spell over June 10-13 with daily means each 5 standard deviations or more above average; 101 F on 10th, highest temperature ever recorded in June.
- 1980 – Warmest February in history (63.5 F)
- 1981 – Warmest year in history to date. Warmest June and warmest Summer (June-August – 74.8 F).
- 1983 – Second warmest year in history to date. Warmest August (77.4 F), October (72.2 F), and Fall (September-November).
- 1984 – Warmest year in history until 2014. Also warmest Spring (March-May), warmest July (77.2 F), and warmest calendar month (78.9 F for September).
- 1987 – Coolest year since 1975.
- 1990 – Wettest June in history (0.87″)
- 1991 – Wettest March (6.96″) since 1867’s 7.88″.
- 1992 – Warmest April in history.
- 1993 – Wettest January in history (9.09″)
- 1995 – 90 F on 19 February warmest ever for this particular calendar month.
- 1997 – Warmest May in history.
- 1998 – Wettest February (7.65″) since 1884.
- 1999 – Coolest year since 1964.
- 2001-02 – Driest Rain Year in all history (2.99″).
- 2003 – Warmest January in history.
- 2004-05 – Wettest October in history (4.98″) and 3rd wettest rain year in history (22.49″).
- 2009 – 98 F on 20 April highest ever for this calendar month.
- 2010 – 100 F on 4 November sets new record maximum for the month
- 2014 – Warmest Year in History
- 2015 – Wettest July in History (1.70″)
* Member, American Meteorological Society