* Member, American Meteorological Society
Graphical Climatology of Downtown Phoenix AZ: Daily Temperatures and Rainfall, by Year (1896 – Present)
 The following is a graphical climatology of Downtown Phoenix, Arizona temperatures and precipitation, from 1896 into 2025. Included are summary overview charts followed by 130-year-to-year graphs depicting daily temperatures, temperature anomalies, and rainfall for each and every year. The 1896-to-present period of record includes observations made by the Weather Service or affiliates from 1896 to May 1933, and at Sky Harbor Airport from June 1933 thereafter. The data were downloaded and processed from the NOAA National Center for Environmental Information (NCEI) and the NWS-Phoenix site (NOWDATA archives and F-6 reports).
Latest Update: 30 Jun 2025 e-mail contact: cjfisk@att.net
CLIMATE OVERVIEW GRAPHS
2025 Daily Temperature and Precipitation Chart for Downtown Phoenix New (6/30/25)
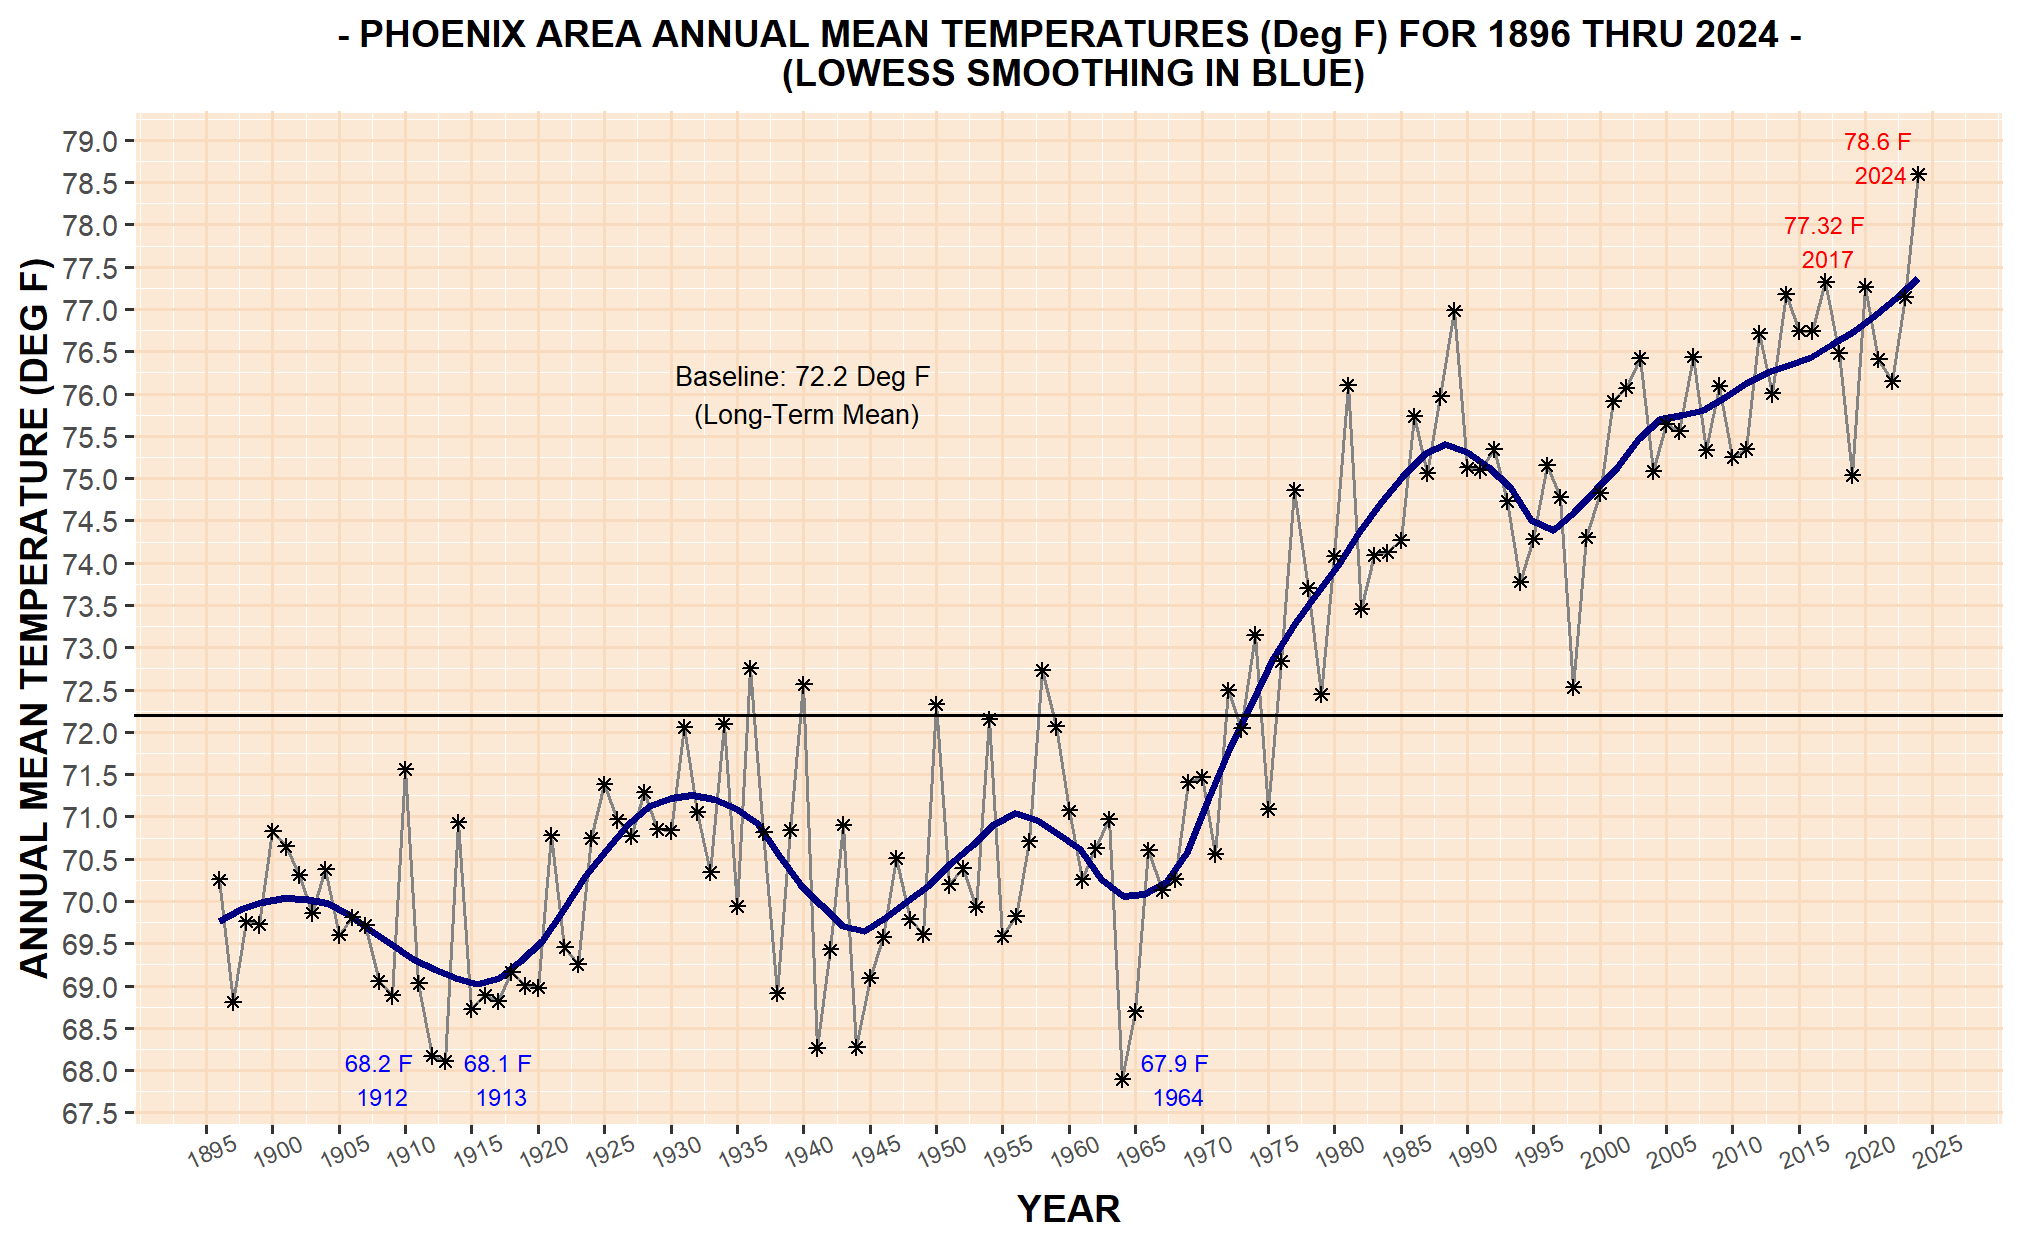
2024 Daily Temperature and Precipitation Chart for Downtown Phoenix – Warmest Year in History (78.6 F)- Surpasses 2017 by 1.3 F
2023 Daily Temperature and Precipitation Chart for Downtown Phoenix –
2022 Daily Temperature and Precipitation Chart for Downtown Phoenix
2021 Daily Temperature and Precipitation Chart for Downtown Phoenix
2020 Daily Temperature and Precipitation Chart for Downtown Phoenix
2019 Daily Temperature and Precipitation Chart for Downtown Phoenix
2018 Daily Temperature and Precipitation Chart for Downtown Phoenix
2017 Daily Temperature and Precipitation Chart for Downtown Phoenix
– HISTORICAL SERIES –
- Downtown Phoenix Annual Mean Temperature History (1896-2024) New (1/6/25)
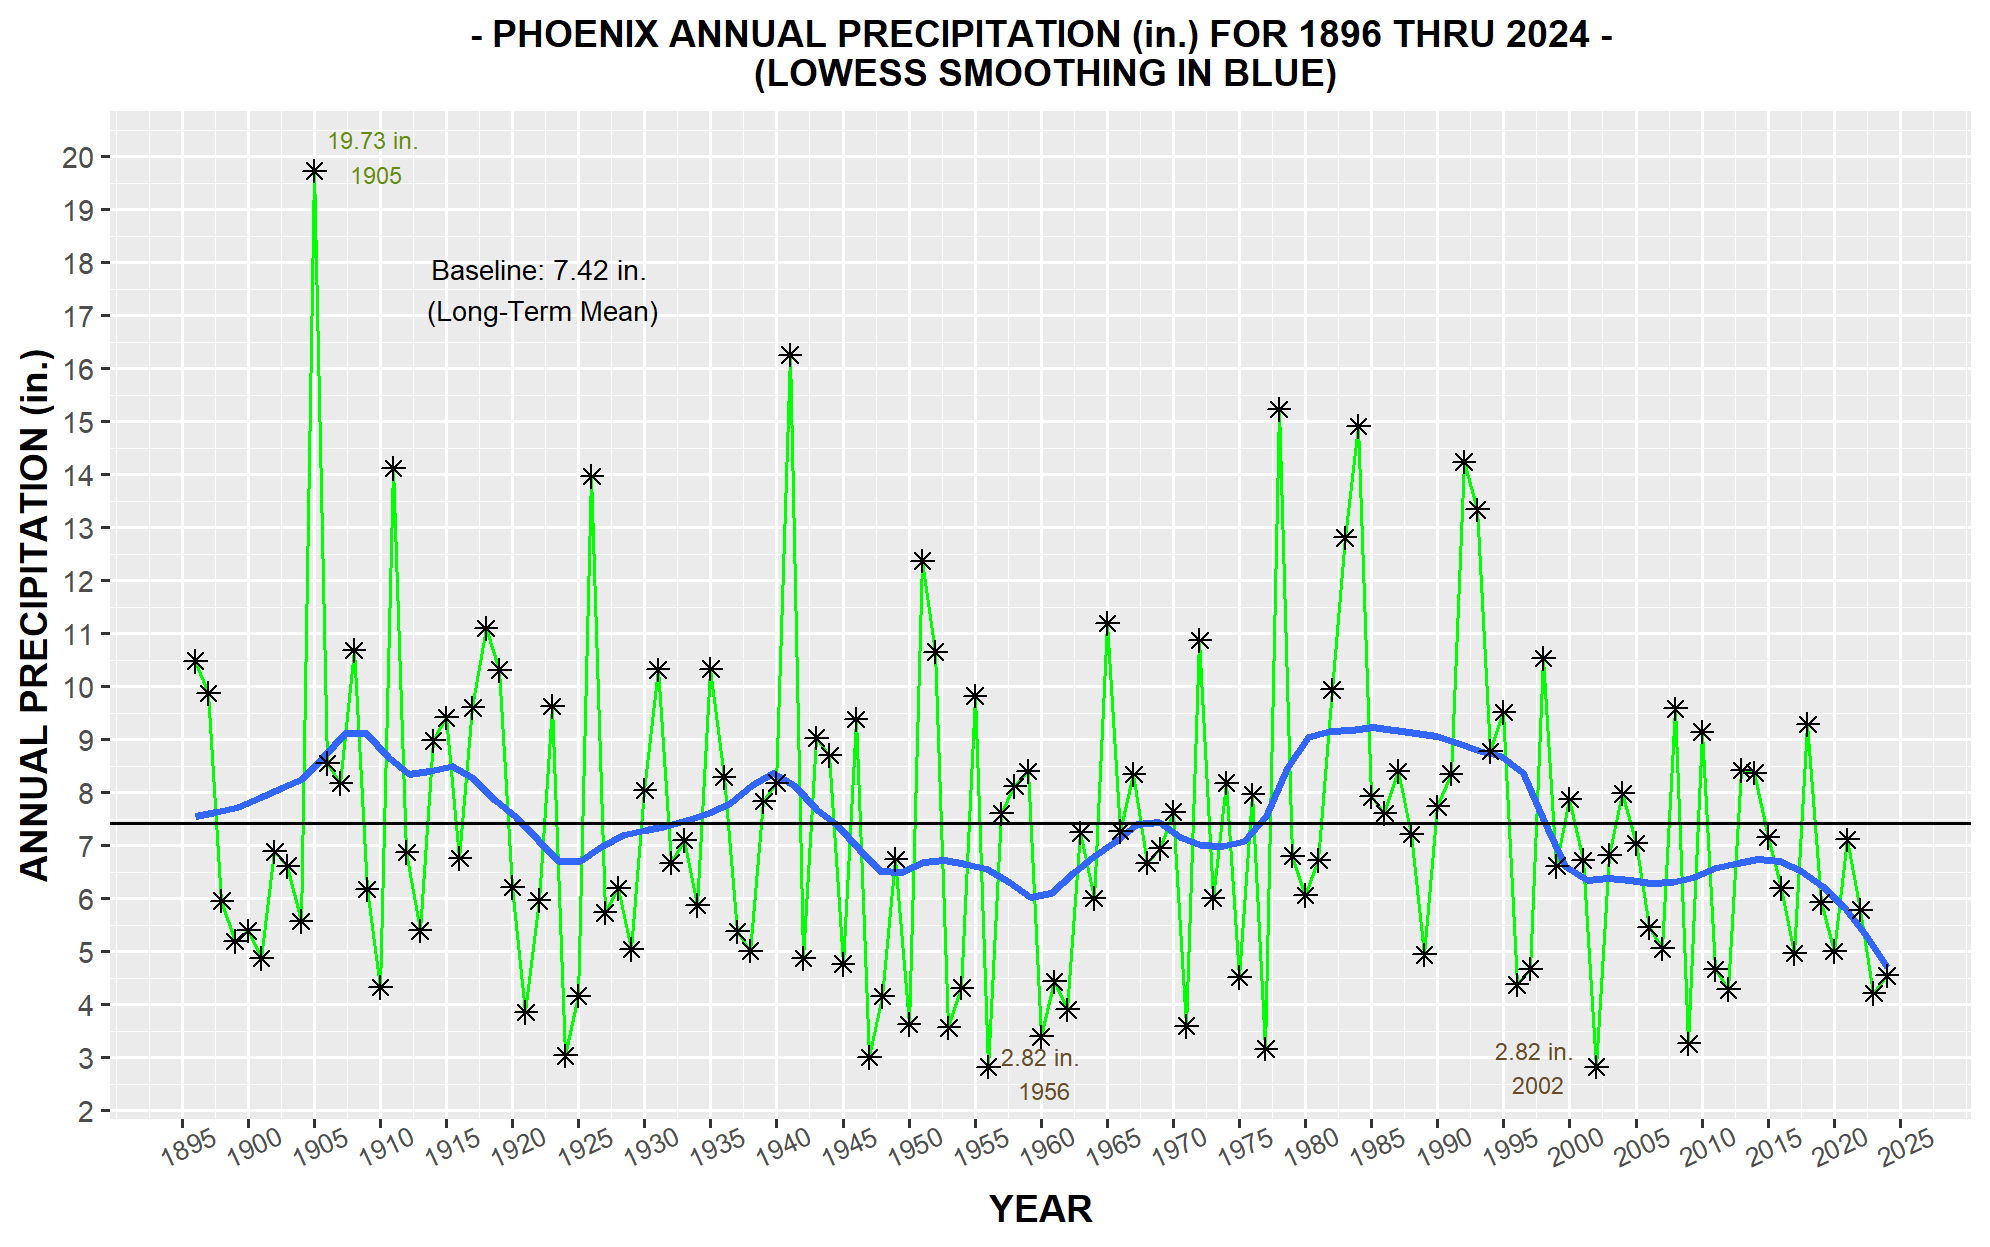
- Downtown Phoenix Calendar Year Precipitation History (1896-2024) New (2/21/25)
- Downtown Phoenix Annual Maximum Temps (1896-2020)
- Downtown Phoenix Annual Minmum Temps (1896-2020)
- Downtown Phoenix Annual Minimum Wind Chill Temperatures (1948-2023) New (9/3/23)
- Downtown Phoenix Annual Maximum Heat Index Temperatures (1948-2023) New (9/3/23)
- Boxplot of Phoenix Monthly Precipitation Distributions (1896-2022)
CLIMOGRAMS FOR PHOENIX (based on data from 1973 on)
- Mean and Extremes’ Hourly Temps (Extremes: 1st and 99th Percentile)
- Mean Hourly Relative Humidities
- Hourly Winds (Mean Vector, Prevailing &, Mean Scalar)
- Hourly Winds (Upper 99th Percentile Sustained Speeds)
- Hourly Ceilings’ Climatology
- Fog
- Blowing Sand/Dust
- Thunderstorms
OTHER SUMMARY CLIMATE CHARTS:
- Downtown Phoenix Average Daily Temperature Ranges, by Calendar Day
- Downtown Phoenix Average Day-to-Day Variability in Max, & Min Temperatures, by Calendar Day
YEAR-TO-YEAR GRAPHS – INTERPRETATION
The uppermost chart for a given year’s page (accessed by the links below) are “floating-bars” of the year’s daily maxima and minima temperatures. Superimposed on the bars are two line traces, the upper one connecting long-term (1896-2020) mean daily maxima, the lower one mean daily minima.
The second chart down shows the day-to-day mean temperature anomalies (daily mean temperature less the corresponding long-term 1896-2020 climatological mean). Departures extending upward in red from the zero line depict above average means for the day, those extending downward in blue indicate below average anomalies. Reflecting the warming temperature trend that Phoenix has experienced, since the 1970’s , daily mean temperature anomalies have become progressively more “red”, some of the most recent years almost exclusively so on an individual daily basis.
(Note: Clicking on the floating-bar charts a second time after they appear on the screen will enlarge them further).
YEAR-TO-YEAR GRAPHS – COMPLETE SET OF LINKS
1896 1897 1898 1899 1900 1901 1902 1903 1904 1905 1906 1907 1908 1909 1910 1911 1912 1913 1914 1915 1916 1917 1918 1919 1920 1921 1922 1923 1924 1925 1926 1927 1928 1929 1930 1931 1932 1933 1934 1935 1936 1937 1938 1939 1940 1941 1942 1943 1944 1945 1946 1947 1948 1949 1950 1951 1952 1953 1954 1955 1956 1957 1958 1959 1960 1961 1962 1963 1964 1965 1966 1967 1968 1969 1970 1971 1972 1973 1974 1975 1976 1977 1978 1979 1980 1981 1982 1983 1984 1985 1986 1987 1988 1989 1990 1991 1992 1993 1994 1995 1996 1997 1998 1999 2000 2001 2002 2003 2004 2005 2006 2007 2008 2009 2010 2011 2012 2013 2014 2015 2016 2017 2018 2019 2020
The third chart down shows the second chart’s daily mean temperature anomalies in deseasonalized (“standardized” or “z-scores”) form . Those of plus or minus 3.0 z are the “extremes of the relative extremes”, these comprising just 0.02% (or 86 individual days’ cases) over the entire history. All but six of these are negatively signed. Greatest positive departure is +3.49 z zfor 26 Aug 2011 (117 F/93 F temperature range), the greatest negative –4.49 z for 20 Sept 1965 (75 F/47 F) temperature range.
The bottom chart depicts daily precipitation totals, as high as 3.30 inches (2 Sept 2014).
LINKS TO SOME OF THE MORE INTERESTING YEAR-TO-YEAR GRAPHS, WITH ACCOMPANYING NOTES
- 2020 – Ties 2017 for warmest year on record (77.3 F). Warmest July (98.9 F) and August (99.0 F) in history, the latter the warmest calendar month on record.
- 2018 – Two separate one-day deluges on October help produce the wettest October on record (5.35″) and 2nd wettest calendar month in history (to July 1911’s 6.47″).
- 2017 – Annual Mean (77.3 F) surpasses 2014 by 0.1 F for warmest year to date.
- 2014 – Surpasses 1989 for warmest year to date (77.2 F). Record daily rainfall total (3.30″) set on 8 September, total for the month: 5.11″, a record
- 2009 – July sets new mark for warmest calendar month (98.3 F).
- 2004 – Warmest March in History.
- 2003 – Daily temperature range on 15 July: 115 F/96 F, 96 F the record highest min ever recorded. July (97.6 F) also warmest calendar month to up to this time.
- 1998 – Coolest year (72.5 F) since 1975; all subsequent annual means from 1976 on, however, at least 1.8 F warmer.
- 1990 – 120 F & 122 F, on 25 and 26 June, respectively, setting all-time warmest daily maxima records.
- 1989 – Warmest year to date (77.0 F), and warmest meteorological Spring (77.7 F) up to the present. July (97.4 F), also warmest calendar month up to this point.
- 1984 – Warmest May on record and 5.15″ rainfall in August.
- 1981 – Another new annual mean temperature high mark (76.1 F).
- 1977 – A new warmest to date mark set (74.9 F).
- 1974 – Warmest year to date (73.4 F). Commences long-term warming trend which continues to present day.
- 1965 – Unseasonably early cold front produces brief spell of far below normal temperatures. Temperature range on 20 Sept: (75/47), 23 F below average and 4.5 standard deviations below.
- 1964 – Coolest year (67.9 F) in Phoenix history
- 1956 – Driest year (2.82″) in Phoenix history.
- 1949 – Cold January. Great short-term gyrating spell in October.
- 1941 – Wettest year in Arizona since 1905. Phoenix records 16.26″. “Coolest” Summer (85.1 F) since 1913.
- 1937– – January 1937 coldest calendar month (43.2 F) in Phoenix history. Temperature range: 39 F/29 F on 21st.
- 1936 – Another warmest to date mark set (72.8 F). First 90F+ daily minimum recorded on 15 July, the next one not to come until 1970.
- 1931 – Warmest year to date (72.1 F).
- 1925 – Temperature hits 118 F on 16 July, highest to date, not surpassed until 1990.
- 1917 – Coolest meteorological Spring (March-May), Mean: 63.1 F
1915 – Very cool early May. Daily temperature range on 1 May only 51921 – Persistent short-term variability pattern in temperature over January thru May.4 F/42 F, 25 F below average.
1913 – Cold wave drops mercury to 16 F on 7 Jan., coldest reading in Phoenix history. Mean temp for day (28.5 F) 4 standard deviations below the 1896-2020 average for 7 January.
1911 – Wettest calendar month in history (July: 6.47″), and coldest December (46.6 F).
1905 – Wettest calendar year in Phoenix recorded history (19.73″), nearly 13″ over Jan -Apr.
1898 – Daily temperature range a wintery 36 F/33 F on 10 December, accompanying by over 1″ precip, snow and rain mixed. Nearby Peoria reports 3″ snow “on the level.”
1896 – First full calendar year of daily observations. Eight consecutive 110 F+ days in mid-June.