Graphical Climatology of Portland, Oregon: Daily Temperatures and Rainfall, by Year (1875 – Present)
")
The following is a graphical climatology of Portland, Oregon temperatures and precipitation, from 1875 into 2026. Included are summary overview charts followed by 152 year-to-year graphs depicting daily temperatures, temperature anomalies, and precipitation.
Data were accessed from the Utah Climate Center and NCDC Online sites, plus that of the NWS-Portland site.
Last update: 28 Jun 2026 — e-mail contact: cjfisk@att.net
CLIMATE OVERVIEW GRAPHS
2026 Daily Temperatures and Precipitation for Portland New (6/28/26)
2025 Daily Temperatures and Precipitation for Portland New (12/31/25)
2024 Daily Temperatures and Precipitation for Portland
2023 Daily Temperatures and Precipitation for Portland – August warmest calendar month (mean: 75.4 F) in History
2022 Daily Temperatures and Precipitation for Portland
2021 Daily Temperatures and Precipitation for Portland
2020 Daily Temperatures and Precipitation for Portland
2019 Daily Temperatures and Precipitation for Portland
2015 Daily Temperatures and Precipitation for Portland Warmest Year in History (57.4 F)
PORTLAND MISC. RAINFALL & TEMPERATURE GRAPHS
- Portland Annual Prcp History (1875-2025) New (1/9/26)
- Portland Annual Mean Temperature History (1875-2025) New (1/9/26)
- Portland Mean and Extreme Daily Max/Min Temps (1875-2020)
- Portland Jul-Jun Total Prcp Histograms
- Boxplot of Portland Individual Calendar Month Precipitation Distributions
- Portland Mean Daily Temperature Range, by Calendar Day
- Portland Annual Coldest Wind Chill Temps – 1948-2023 New (9/5/23)
- Portland Annual Warmest Heat Index Temps – 1948-2023 New 9/5/23)
CLIMOGRAMS FOR PORTLAND & OTHER CHARTS
- Mean & Extreme Hourly Temps (99% & 1% Percentile Levels), + Stdv’s and Skewness Coeff’s
- Mean & Extreme Hourly Rel Hum’s (1% Percentile Levels)
- Mean Vector Wind Directions, Speeds, and Constancies
- Prevailing 8-Point Compass Wind Directions, Frequencies, and Mean Speeds
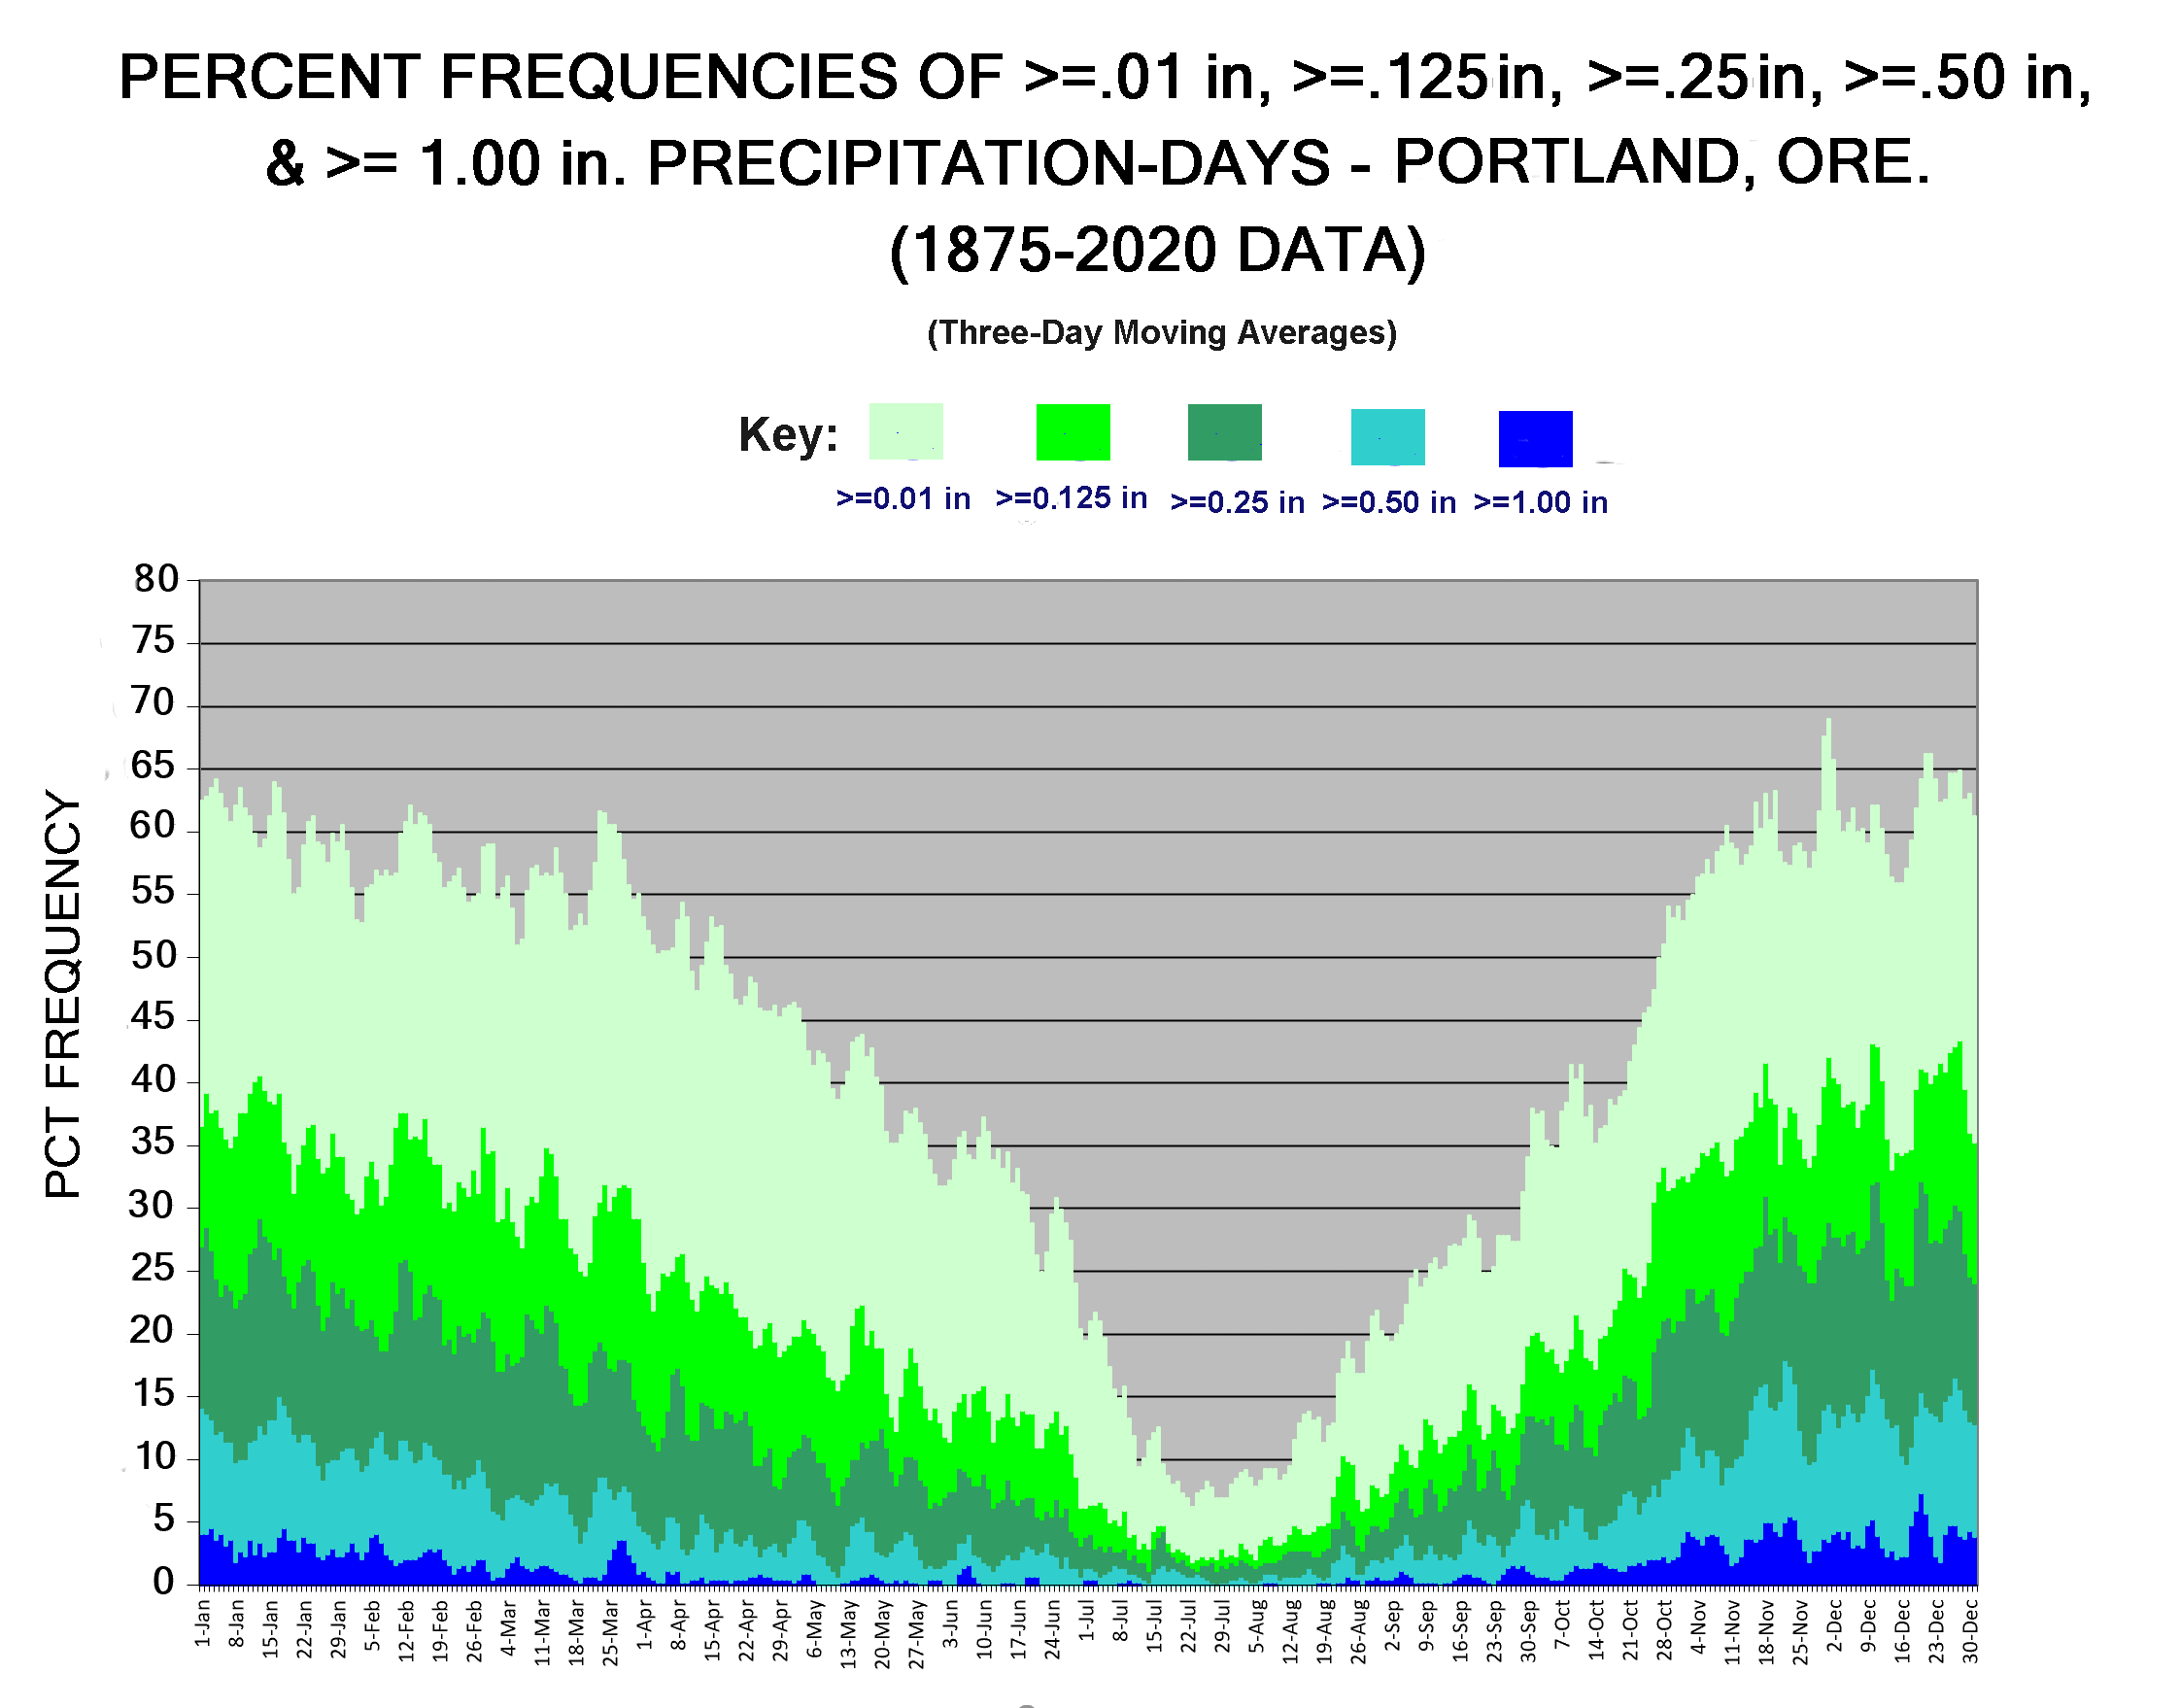
- Percent Frequencies of >=.01in, >=.125in, >=.25in, >=.50in, and >=1.00in Precipitation Days (1875-present)
- Mean Scalar Wind Speeds
- Extreme Highest Sustained Winds (99% Percentile Level)
- Cloud Ceilings
- Fog/Haze
- K-Means Clustering Analysis of Portland Diurnal Resultant Wind Patterns –
YEAR-TO-YEAR GRAPHS – INTERPRETATION
The uppermost chart for a given year’s page (see links below) are “floating-bars” of the year’s daily maxima and minima temperatures. The bars depict the varying diurnal, synoptic, long-wave, seasonal, and sea-surface temperature anomaly influences on Portland temperature over time.
The second chart down shows the day-to-day mean temperature anomalies (daily mean temperature less the corresponding long-term climatological mean). Vertical lines extending upward from the zero line indicate above average means for the day (colored red), those extending downward indicate below average daily means (colored blue).
(Note: Clicking on the floating-bar charts a second time after they appear on the screen will enlarge them even further).
YEAR-TO-YEAR GRAPHS – COMPLETE SET OF LINKS
1875 1876 1877 1878 1879 1880 1881 1882 1883 1884 1885 1886 1887 1888 1889 1890 1891 1892 1893 1894 1895 1896 1897 1898 1899 1900 1901 1902 1903 1904 1905 1906 1907 1908 1909 1910 1911 1912 1913 1914 1915 1916 1917 1918 1919 1920 1921 1922 1923 1924 1925 1926 1927 1928 1929 1930 1931 1932 1933 1934 1935 1936 1937 1938 1939 1940 1941 1942 1943 1944 1945 1946 1947 1948 1949 1950 1951 1952 1953 1954 1955 1956 1957 1958 1959 1960 1961 1962 1963 1964 1965 1966 1967 1968 1969 1970 1971 1972 1973 1974 1975 1976 1977 1978 1979 1980 1981 1982 1983 1984 1985 1986 1987 1988 1989 1990 1991 1992 1993 1994 1995 1996 1997 1998 1999 2000 2001 2002 2003 2004 2005 2006 2007 2008 2009 2010 2011 2012 2013 2014 2015 2016 2017 2018 2019 2020
The third chart down shows the second chart’s anomalies in deseasonalized (“standardized”) form. This adjusts for the fact that individual calendar days have higher or lower inherent year-to-year variability in mean temperature. To create a common relative anomaly scale for each day, the anomalies are divided by their corresponding calendar day standard deviations to generate “standardized departures” or “z-scores”. Those scores of plus or minus 3.0 occur just 0.6% of the time; Greatest positive standardized departure in the record is +4.05 z for 29 Jul 2009, greatest negative –4.74 z for 15 Nov 1955.
The bottom chart depicts daily precipitation totals, as high as 6.68 inches (13 Dec 1882).
SELECTED INDIVIDUAL YEARS’ WITH INTERESTING PATTERNS
1875 – Year One – Very Cold January and Cold February-March.
1882 – Wettest Calendar Year in History (67.24″). December Wettest Calendar Month on Record (20.14″).
1884 – 34.1″ Snow in December.
1888 – Very Cold over most of January; -2 F on 15th.
1890 – 35.3″ Snow in January.
1893 – Coldest Year (50.2 F) until 1964.
1896 – Large Daily Temperature Anomalies – RMSE of Standardized Daily Mean Departures (1.22) highest of any year
1899 – Second highest RMSE of any year (1.18)
1926 – Very warm first half of year; also mildest April – Effect of Strong El Nino of 1926
1933 – December 2nd wettest calendar month in history (17.47″)
1934 – Warmest Year in history up to this time (57.36 F); mildest Spring (Mar-May) – 58.8 F
1935 – 105 F on 13 July highest temperature recorded to-date.
1941 – Five consecutive days with 100 F or higher temps, 13-17 July.
1942 – 107 F on 2 July, record highest temperature
1944 – Driest Calendar Year (23.37″) up to this time; 101 F on 5th, latest 100 F + temperature ever recorded.
1950 – January Coldest Calendar Month in History (27.0 F); also, -2 F on 31 Jan, -3 F on 2 Feb. January also Snowiest Calendar Month in History (41.4″); 30 consecutive days with measurable snow depth over January and February.
1953 – Mildest January in History (47.3 F)
1954 – Coolest Summer in History (June-August : 61.5 F)
1955 – Coldest Spring in History (March-May : 47.0 F). Spectacular early November temperature plunge and ensuing six-day cold spell.
1964 – Coldest Year in History (50.1 F)
1965 – 107 F on 30 July.
1981 – 103 F, 107 F, 105 F, and 107 F recorded on 7-10 August
1985 – Driest Year in History (22.48″) – July warmest Calendar Month in History (74.1 F). Also very cold November & December.
1996 – Wettest Calendar Year (63.20″) since 1882
2000 – Lowest RMSE of any year (.803)
2009 – 106 F on 28 and 29 July
2014 – Warmest September in History (67.6 F); Warmest Fall (Sept-Nov : 58.0 F)
2015 – Warmest Year in History (57.4 F) also warmest June & October, and Warmest Summer (June-August : 72.2 F)
2017 – Warmest August in History (73.6 F)