* Member, American Meteorological Society
Graphical Climatology of Downtown Los Angeles: Daily Temperatures and Rainfall, by Year (1877 – Present)
The following is a graphical climatology of Downtown Los Angeles, California temperatures and precipitation, from 1877 into 2025. Included are summary overview charts followed by 149-year-to-year graphs depicting daily temperatures, temperature anomalies, and rainfall. The 1877-to-present period of record comprises observations accessed from the National Centers for Environmental Information (NCEI), the NOAA Online Data Weather Data Site (NOWDATA) and the NWS Office-Los Angeles/Oxnard site (Downtown Los Angeles Climate page): http://www.weather.gov/climate/index.php?wfo=lox.
Latest Update: 17 Jun 2025 e-mail contact: cjfisk@att.net
CLIMATE OVERVIEW GRAPHS
2025 Daily Temperature and Precipitation Chart for Downtown Los Angeles New (6/17/25)
2024 Daily Temperature and Precipitation Chart for Downtown Los Angeles
2024-25 Season-to-Date Downtown Los Angeles Precipitation New (6/17/25)
2023 Daily Temperature and Precipitation Chart for Downtown Los Angeles
2022 Daily Temperature and Precipitation Chart for Downtown Los Angeles
2021 Daily Temperature and Precipitation Chart for Downtown Los Angeles
2020 Daily Temperature and Precipitation Chart for Downtown Los Angeles
2019 Daily Temperature and Precipitation Chart for Downtown Los Angeles
2018 Daily Temperature and Precipitation Chart for Downtown Los Angeles
- Downtown Los Angeles July-June Measurable Precipitation Days (1877-78 thru 2022-2023 Seasons)
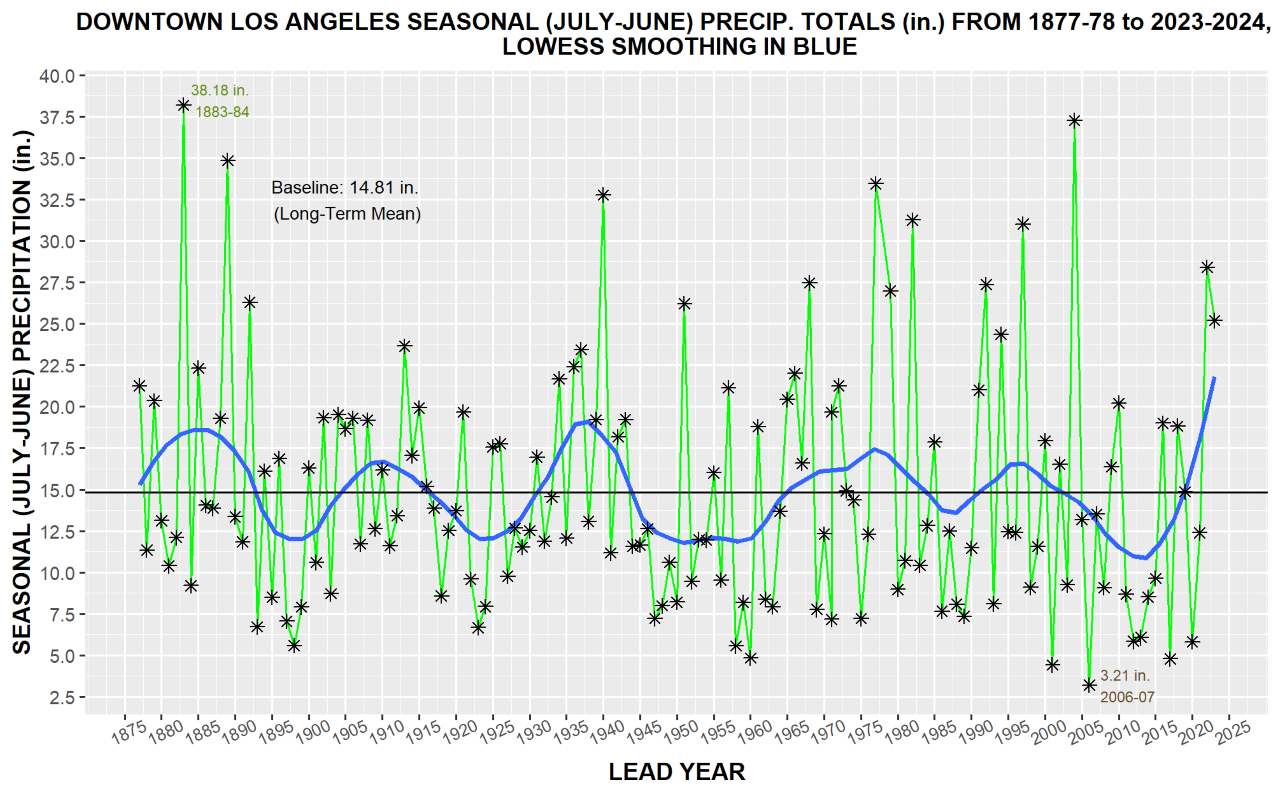
- Downtown Los Angeles July-June Seasonal Precipitation Totals (1877-78 thru 2023-24 Seasons) – New (5/22/24)
- Box Plot for Downtown Los Angeles Historical Monthly Rainfall
- Box Plot of Downtown Los Angeles Historical Monthly Max Temps
- Downtown Los Angeles Average Monthly Rainfall for El Nino, La Nina, & Neutral Episodes|
Downtown Los Angeles Average Season-to-Date Rainfall Curves for El Nino, La Nina, & Neutral Episodes
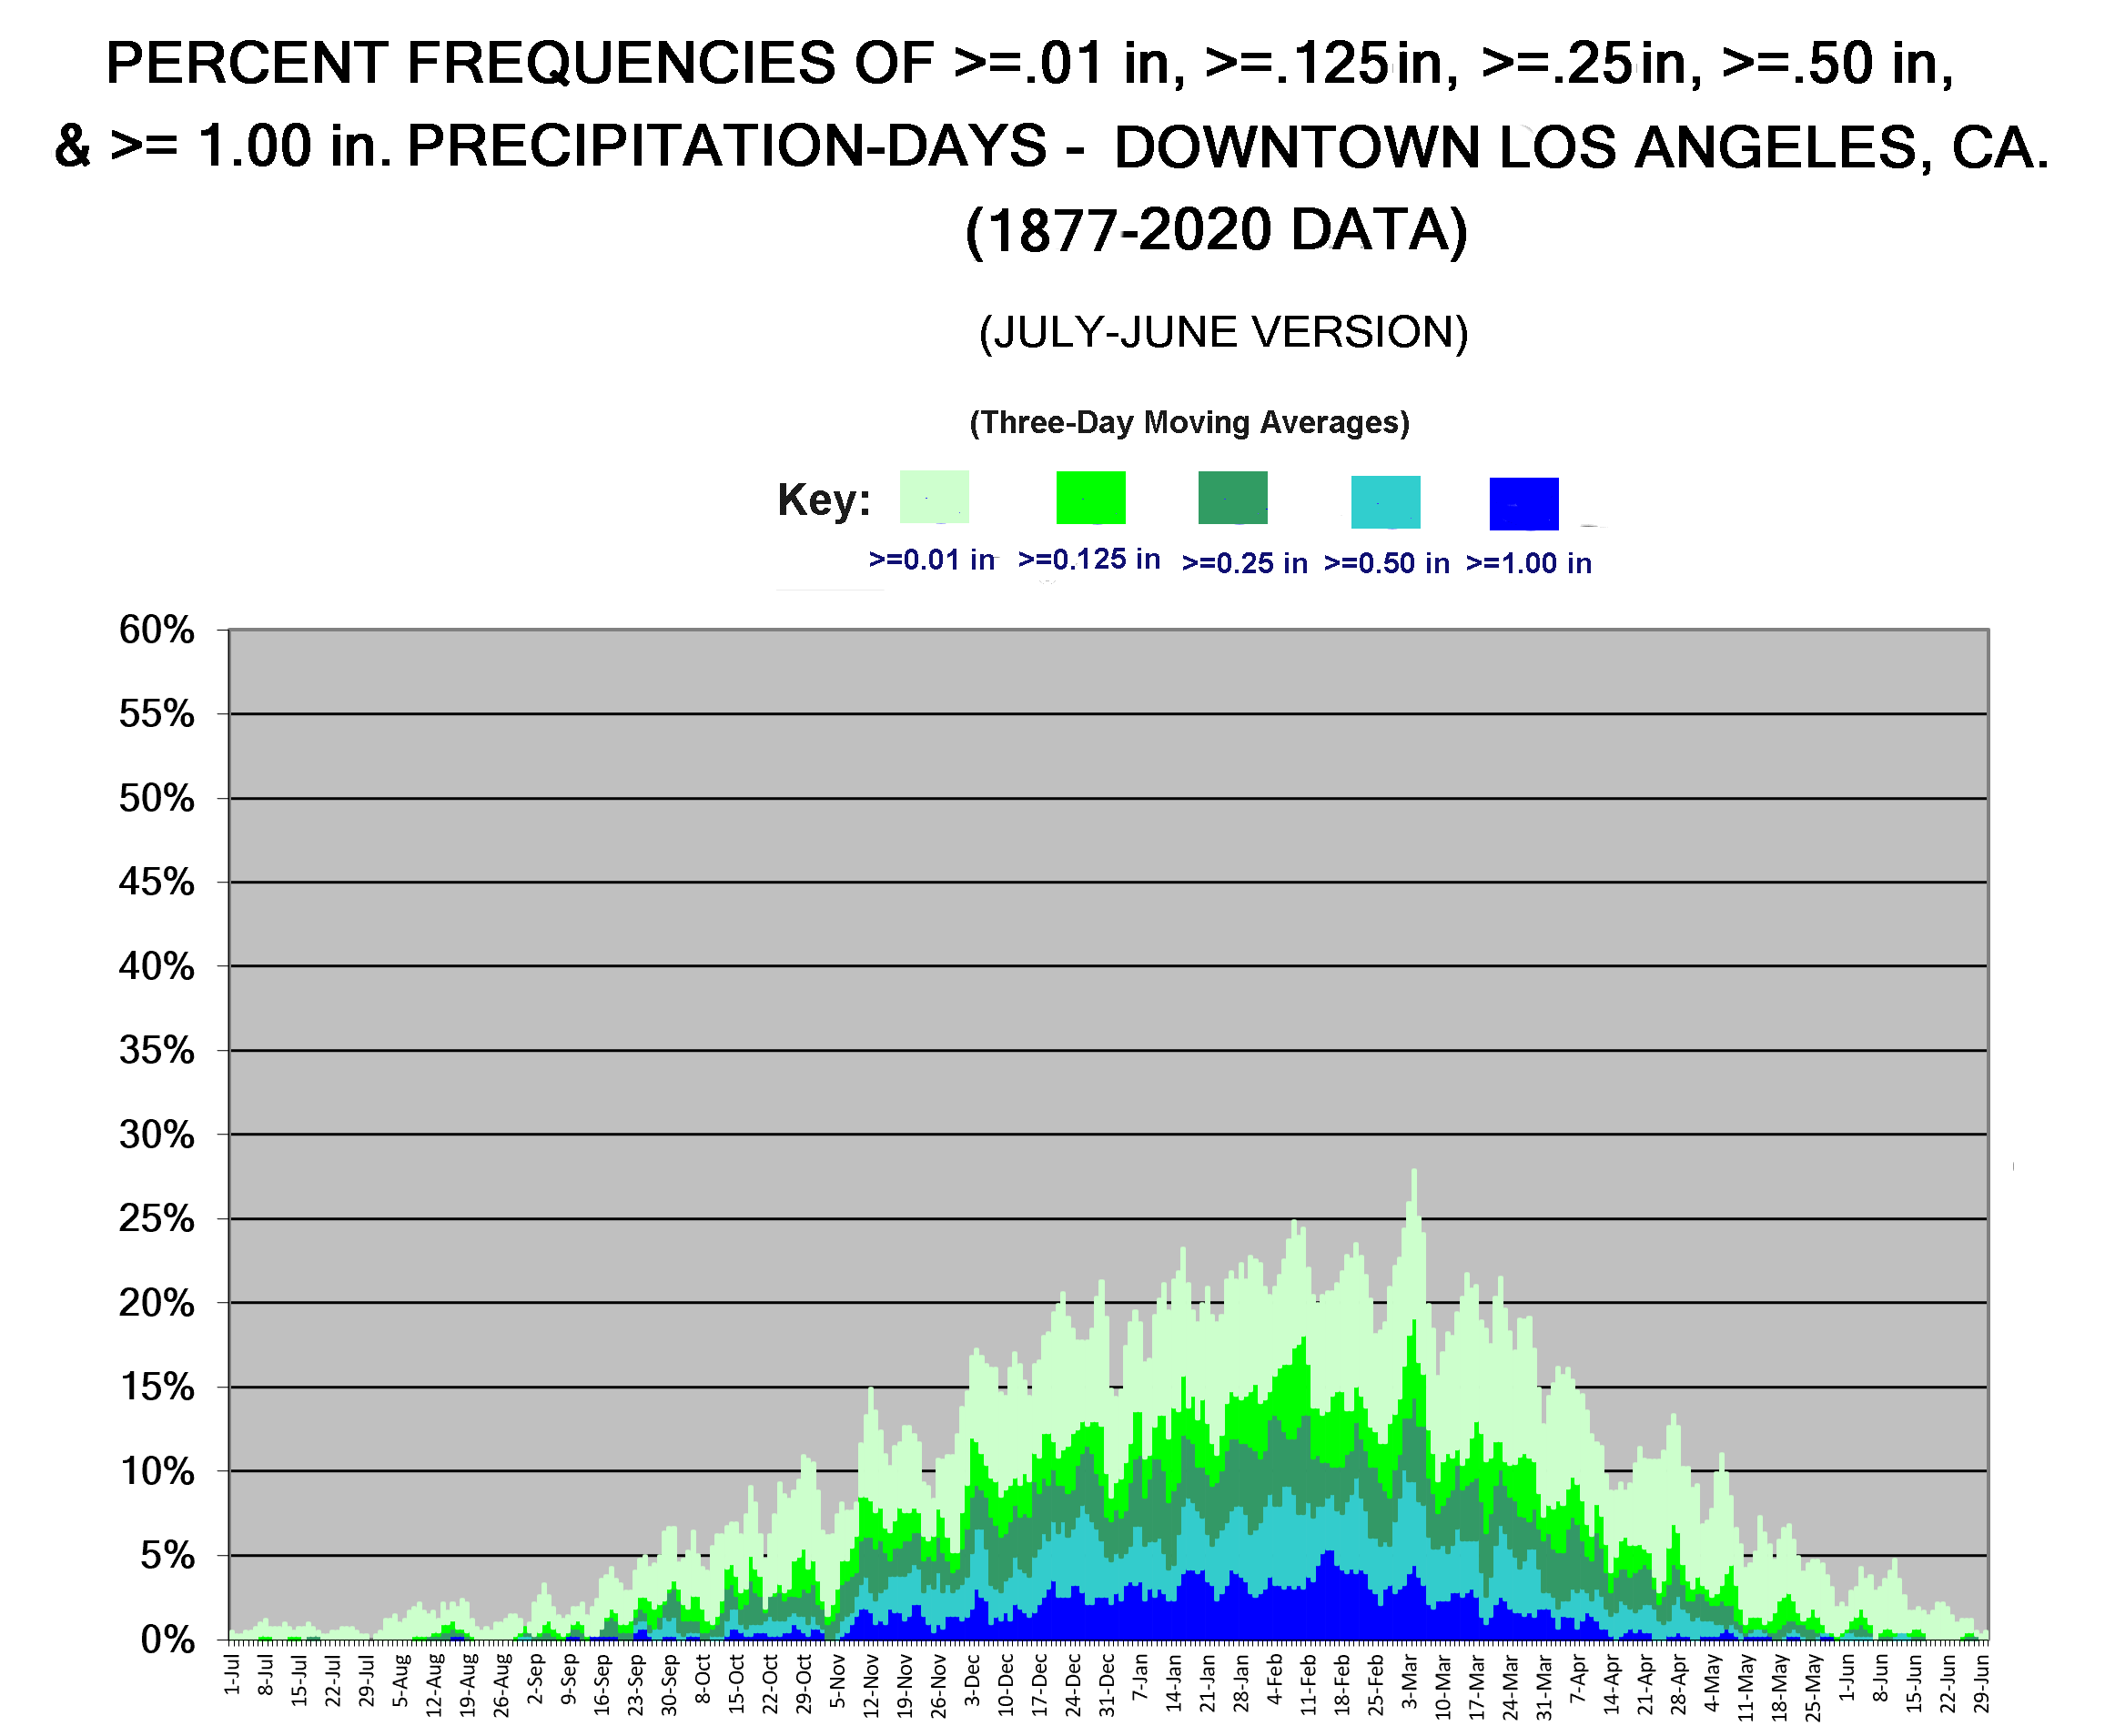
Downtown Los Angeles Pct. Frequencies of >=0.01 in., >=0.125 in., >= 0.25 in, >=0.50 and >=1.00 in. Rainfall Days, by Calendar Day (1877-2020)
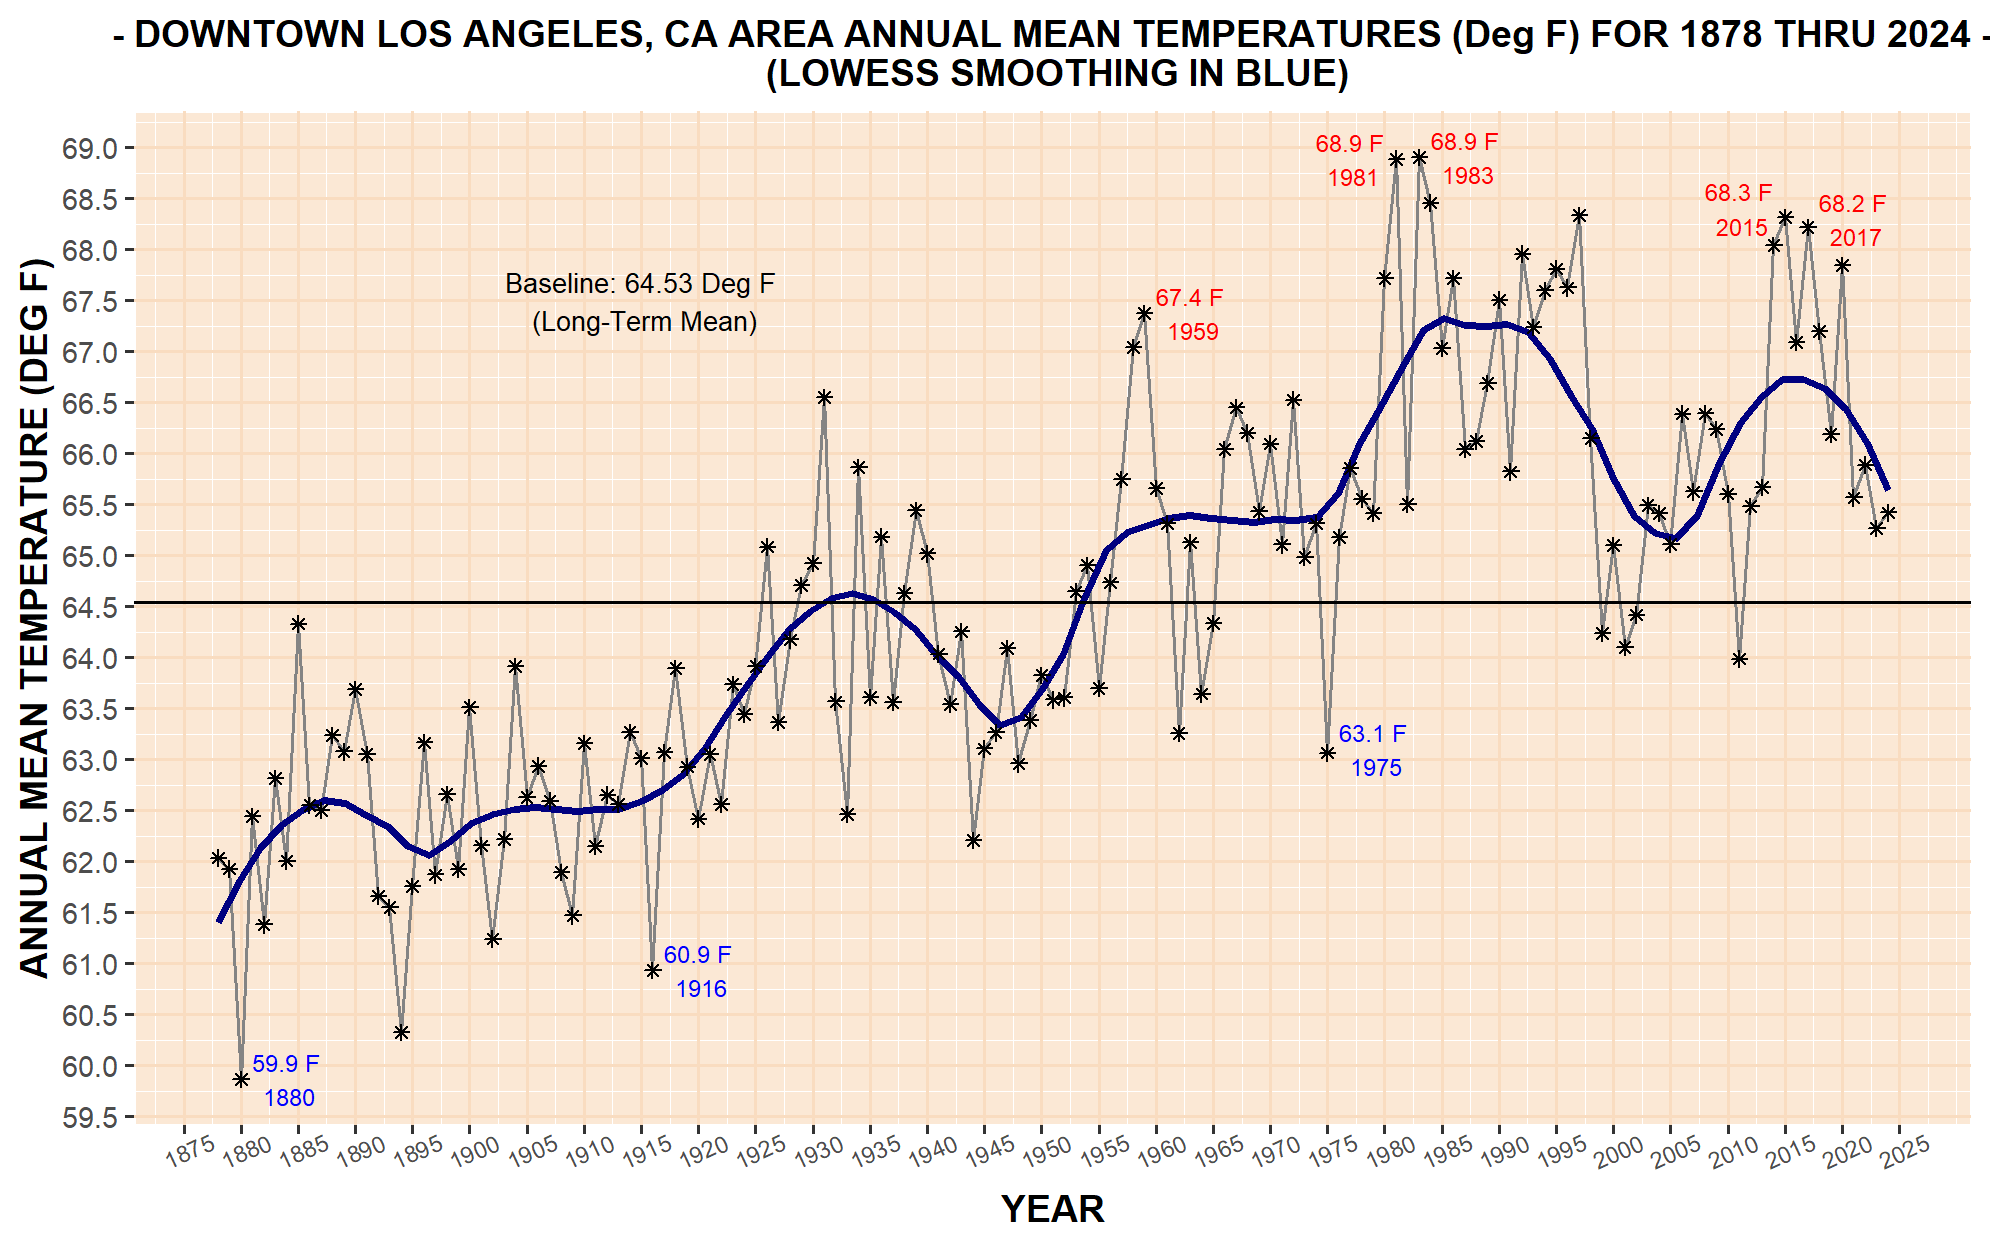
ANNUAL MEAN TEMPERATURE:
Downtown Los Angeles Annual Mean Temperatures (1878-2024) New – (1/7/25)
DAILY MEAN & EXTREME TEMPERATURES:
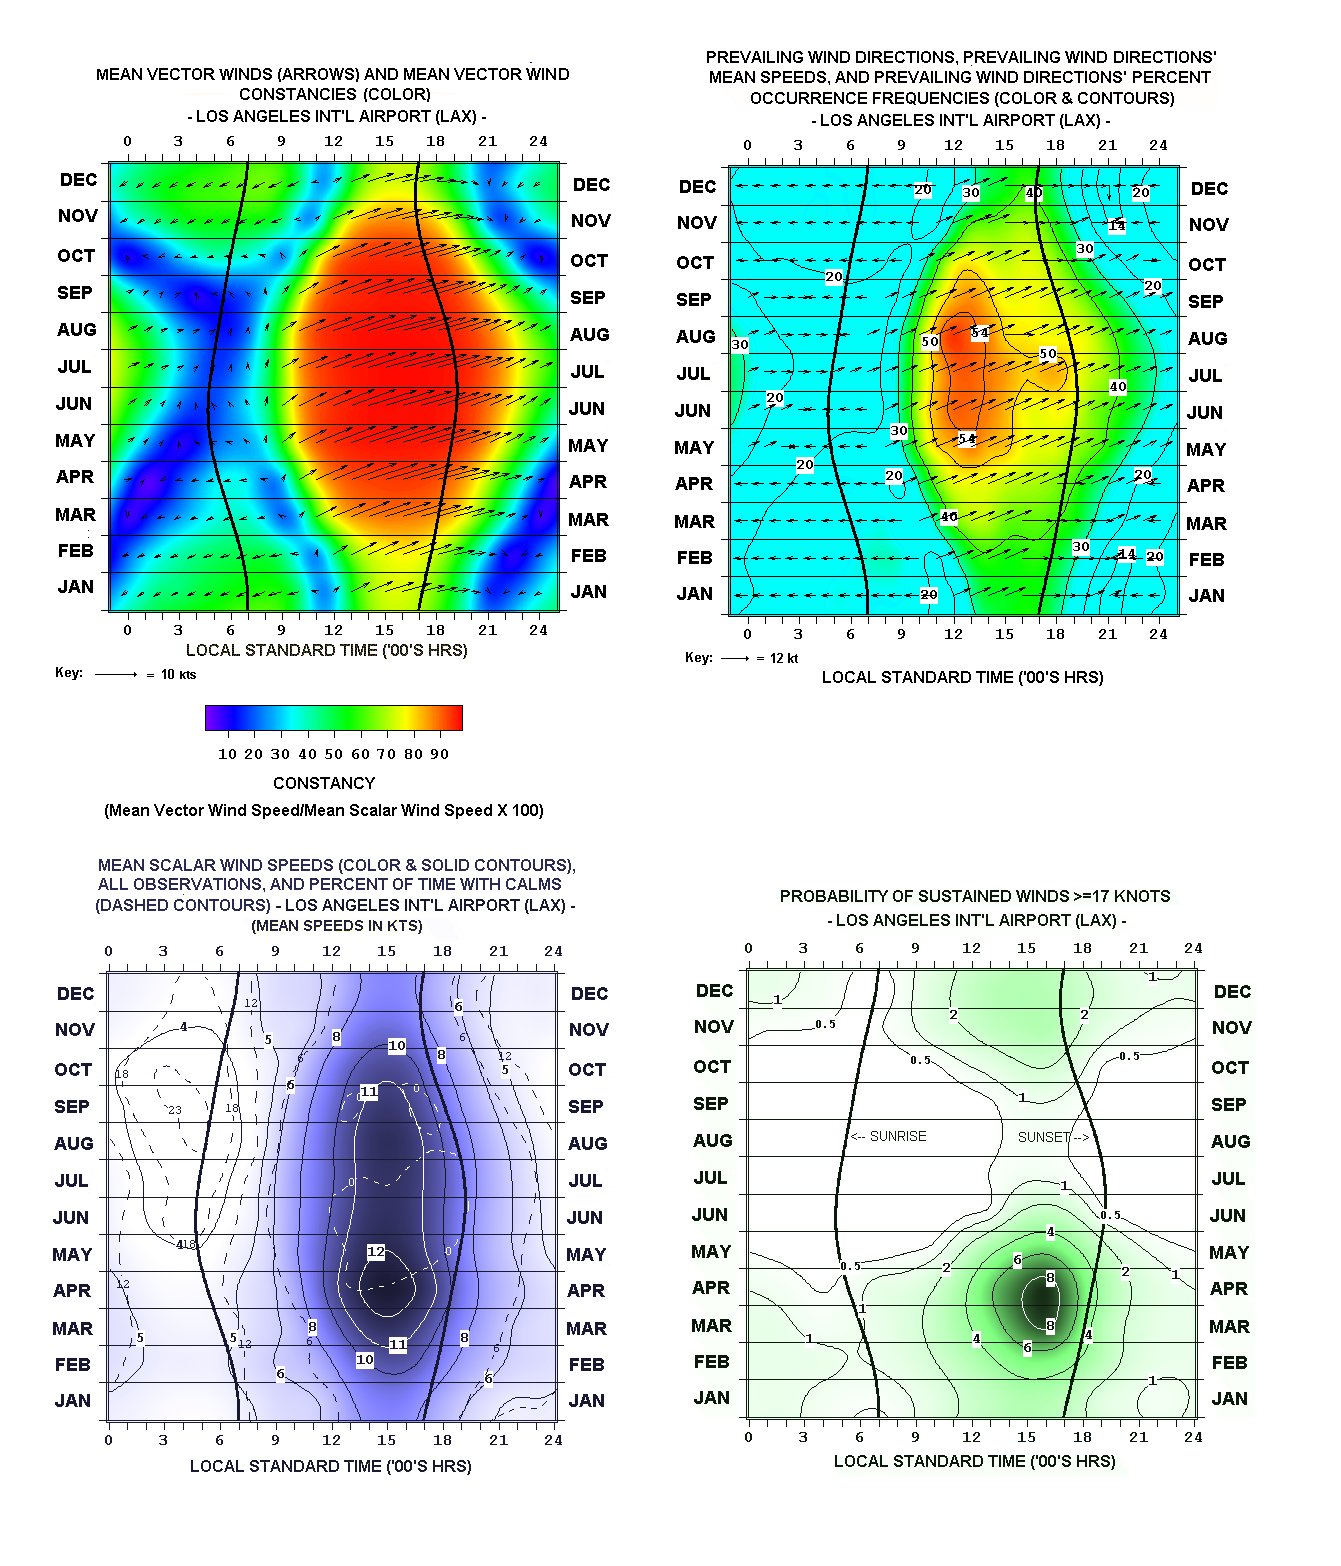
CLIMOGRAMS FOR LOS ANGELES INT’L AIRPORT:
- Mean and Extremes’ Hourly Temps (1st and 99th Percentile)
- Mean and Extremes’ Hourly Rel Hum’s (1st Percentile)
- Winds (Mean Vector, Prevailing, Mean Scalar, & Pct High)
- Winds (Upper 99th Percentile Sustained)
- Flying Weather/Ceilings
- Fog/Haze
- Precipitation
- Blowing Sand/Dust
- Thunderstorms
OTHER CLIMATE SUMMARIES:
- Downtown Los Angeles Average Daily Temperature Ranges, by Calendar Day
- Coldest Wind Chill Temperatures, by Year (1948-2023) – New (9/6/23)
- Warmest Heat Index Temperatures, by Year (1948-2023) – New (9/6/23)
- Downtown Los Angeles Average Day-to-Day Variability in Mean, Max, & Min Temperatures, by Calendar Day
- Downtown Los Angeles Inter-Year Variability (Standard Deviation) Statistics for Daily Mean, Max, & Min Temperatures
- Record Warmest Combined Max/Min’s by Calendar Day (1877-2021) New (2/24/21)
Record Coldest Combined Max/Min’s by Calendar Day (1877-2021) New (2/24/2021) - Cluster Analysis of LAX Diurnal Resultant Winds’ Patterns
- Cluster Analysis of Long Beach Diurnal Resultant Winds’ Patterns
YEAR-TO-YEAR GRAPHS – INTERPRETATION
The uppermost chart for a given year’s page (accessed by the links below) are “floating-bars” of the year’s daily maxima and minima temperatures. Superimposed on the bars are two line traces, the upper one connecting long-term mean daily maxima, the lower one mean daily minima.
The bars depict the varying diurnal, synoptic, long-wave, seasonal, and sea-surface temperature anomaly influences on L.A. temperature over time, and for effect they are deliberately adjoined with no spaces in-between, creating a sort-of “signature” look. The same is done with the anomaly time-series further down.
The second chart down shows the day-to-day mean temperature anomalies (daily mean temperature less the corresponding long-term climatological mean). Vertical lines extending upward from the zero line (colored red) indicate above average means for the day, those extending downward (colored blue) depict below average ones. In general, the most extreme departures for Downtown Los Angeles are positive, reflecting to a large extent the occurrence of warming offshore flow episodes. (Clicking on the floating-bar charts a second time after they appear on the screen will enlarge them even further).
YEAR-TO-YEAR GRAPHS – COMPLETE SET OF LINKS
1877 1878 1879 1880 1881 1882 1883 1884 1885 1886 1887 1888 1889 1890 1891 1892 1893 1894 1895 1896 1897 1898 1899 1900 1901 1902 1903 1904 1905 1906 1907 1908 1909 1910 1911 1912 1913 1914 1915 1916 1917 1918 1919 1920 1921 1922 1923 1924 1925 1926 1927 1928 1929 1930 1931 1932 1933 1934 1935 1936 1937 1938 1939 1940 1941 1942 1943 1944 1945 1946 1947 1948 1949 1950 1951 1952 1953 1954 1955 1956 1957 1958 1959 1960 1961 1962 1963 1964 1965 1966 1967 1968 1969 1970 1971 1972 1973 1974 1975 1976 1977 1978 1979 1980 1981 1982 1983 1984 1985 1986 1987 1988 1989 1990 1991 1992 1993 1994 1995 1996 1997 1998 1999 2000 2001 2002 2003 2004 2005 2006 2007 2008 2009 2010 2011 2012 2013 2014 2015 2016 2017 2018 2019 2020
The third chart down shows the second chart’s anomalies in deseasonalized (“standardized”) form. Those of plus or minus 3.0 z occur just 0.5% of the time; nearly all of these positively signed, again reflecting extreme warming offshore flow episodes. Greatest positive departure in the record is +5.63 for 7 June 1890, greatest negative –3.13 for 22 January 1937.
The bottom chart depicts daily precipitation totals, as high as 5.88 inches (2 March 1938).
LINKS TO SOME OF THE MORE INTERESTING YEAR-TO-YEAR GRAPHS, WITH ACCOMPANYING NOTES
- 1880 – Coolest Year in History (59.9 F).
- 1884 – Wettest Calendar Year in History (40.29″).
- 1885 – 108 F in September.
- 1889 – December wettest calendar month in history (15.80″).
- 1890 – 105 F/70 F on 7 June.
- 1891 – In otherwise cool year, 109 F on 25 July, warmest in history until 110 F on 1 September 1955.
- 1897 – Eight-day ramp-up in daily temperatures, from 58 F/30 F on 21 December to 89 F/57 F on 29th.
- 1907 – Eight-consecutive-day offshore flow episode in February, max temperatures all in 80’s F.
- 1909 – Quasi-periodic, well above normal, but abbreviated temperature spells over late August into early November.
- 1912 – 6.99″ precipitation in March, but just 9.78″ for entire year.
- 1913 – Sharp cold front drops mercury to record all-time low 28 F on 7 January, following 83 F maximum on the 3rd. 4.80″ rain on 24 Feb. 108 F on 17 September.
- 1914 – March/April and October/November each unseasonably warm, the other calendar months unseasonably cool.
- 1916 – February to April unseasonably warm, rest of year mostly unseasonably cool.
- 1917 – Following a cooler than normal earlier part of the year, quasi-periodic, abbreviated, but much above normal temperature spells appear June on.
- 1926 – More than 7 ½” rain in April – most for any April in all history (1878-present).
- 1931 – Warmest year in the historical record up to this point.
- 1932 – Sharp early December cold snap follows warmest November of the entire history (1877-present).
- 1937 – Very cold January, highest temperature only 61 F. Each of the year’s first 58 days colder than average. Killing freezes all over SoCal.
- 1938 – Torrential late February/early March rains cause severe local flooding; 11.06″ rain over five days, 5.88” on 2 March.
- 1939 – Week-long September heat wave precedes landfall of dissipating hurricane, which drops more than 5” rain in Downtown LA. Warmest December of entire history (1877-present).
- 1940-41 – Wettest July-June “water year” (32.76”) since 1883-84, and until 1977-78.
- 1948-49 – Coldest meteorological winter (December-February) and calendar month (January) of entire history. Record coldest minimum (28 F) tied on 4 January.
- 1953 – Driest calendar year (4.08”) in all history.
- 1955 – Eight-day run of 100 F or higher maxima from 31 August; 110 F on 1 September.
- 1959 – Warmest calendar year to date.
- 1960-61 – Driest water year (4.85”) in history up to this time.
- 1963 – Late September heat wave.
- 1965 – October heat wave, but more than 15” rain in November and December.
- 1966 – 100 F on 1 November.
- 1967 – Highly irregular day-to-day temperature pattern over course of year. Nearly 8 3/4” rain in November.
- 1969 – January wettest calendar month (14.94”) since December 1889.
- 1971 – Another highly irregular day-to-day temperature pattern over course of year.
- 1971-72 – Nearly all the water year’s precipitation falls in December.
- 1975 – Coolest year since 1948.
- 1977-78 – Wettest water year (33.44”) since 1883-84 and until 2004-05.
- 1980 – Warmest year of entire history to date. Heavy February rains.
- 1981 – Another record warm year (surpasses 1980’s mark by 1.2 F). June also warmest in history.
- 1983 – Great El Nino year. Wettest calendar year, 1921-present (34.04”). Another record warmest year (surpasses 1981’s mark by <0.1 F).
- 1984 – September warmest calendar month in all history.
- 1985 – Warmest July in all history up to this time – 107 F on 1st.
- 1986 – Warmest January in all history.
- 1988 – 110 F on 1 September.
- 1989 – 106 F in April surpasses previous high mark for month by 7 F.
- 1990 – 112 F on 26 June sets all time high mark for any month. Late December cold spell.
- 1990-91 – “March Miracle” water year. Heavy late-February and March rains set in after exceptionally dry winter up to this point.
- 1992 – Warmest April of entire history.
- 1995 – More than 12 ½” rain in January. Warmest February of entire history.
- 1997 – No recorded rainfall from 18 Feb through 24 Sep – 219 days.
- 1998 – The other great El Nino year of the 20th Century. Nearly 13 ¾” rain in February.
- 2001 – Coolest year since 1975.
- 2004-05 – Wettest water year (37.25”) since 1883-4 and 2nd wettest in all recorded history.
- 2006 – Coolest March since 1962. Warmest July in all history.
- 2006-07 – Driest water year (3.21”) in recorded history.
- 2010 – 113 F on 27 September sets all time highest mark for any month.
- 2014 – Warmest Year since 1997.
- 2015 – July Wettest in History (0.38″)
OTHER CLIMATOLOGICAL WEBSITES OF INTEREST
AGRICULTURAL AND METEOROLOGICAL SOFTWARE