Graphical Climatology of Helsinki, Finland: Daily Temperatures and Rainfall, by Year (1959 – Presesnt)
 The following is a graphical climatology of Helsinki, Finland (Vantaa station) temperatures and precipitation, from 1959 into 2025. Included are summary overview charts followed by 67 year-to-year graphs depicting daily temperatures, temperature anomalies, precipitation, and snow depths. The temperature and precipitation data are converted from metric units to (rounded) degrees F, and inches, respectively; the snowdepths from cm to inches.
Source is the Finnish Meteorological Institute climate statistics site:
https://en.ilmatieteenlaitos.fi/climate-statistics
In addition to the daily temperature and precipitation variations of selected parameters on single-page grid-layouts analogous to topographic maps. These are derived from downloaded raw hourly observational data from the NOAA NCDC’s “Access to Global Hourly Surface Data” online site:
https://www.ncei.noaa.gov/access/search/data-search/global-hourly
Author: Charles Fisk e-mail contact: cjfisk@att.net
Latest update: 1 Aug 2025
CLIMATE OVERVIEW GRAPHS
Helsinki Daily Temperatures and Precipitation for 2025 New (8/1/25)
Helsinki Daily Temperatures and Precipitation for 2024
Helsinki Daily Temperatures and Precipitation for 2023
Helsinki Daily Temperatures and Precipitation for 2022
Helsinki Daily Temperatures and Precipitation for 2021
Helsinki Daily Temperatures and Precipitation for 2020
Helsinki Daily Temperatures and Precipitation for 2019
HELSINKI MISCELLANEOUS
CLIMATOLOGICAL RAINFALL, SNOWFALL, AND TEMPERATURE GRAPHS
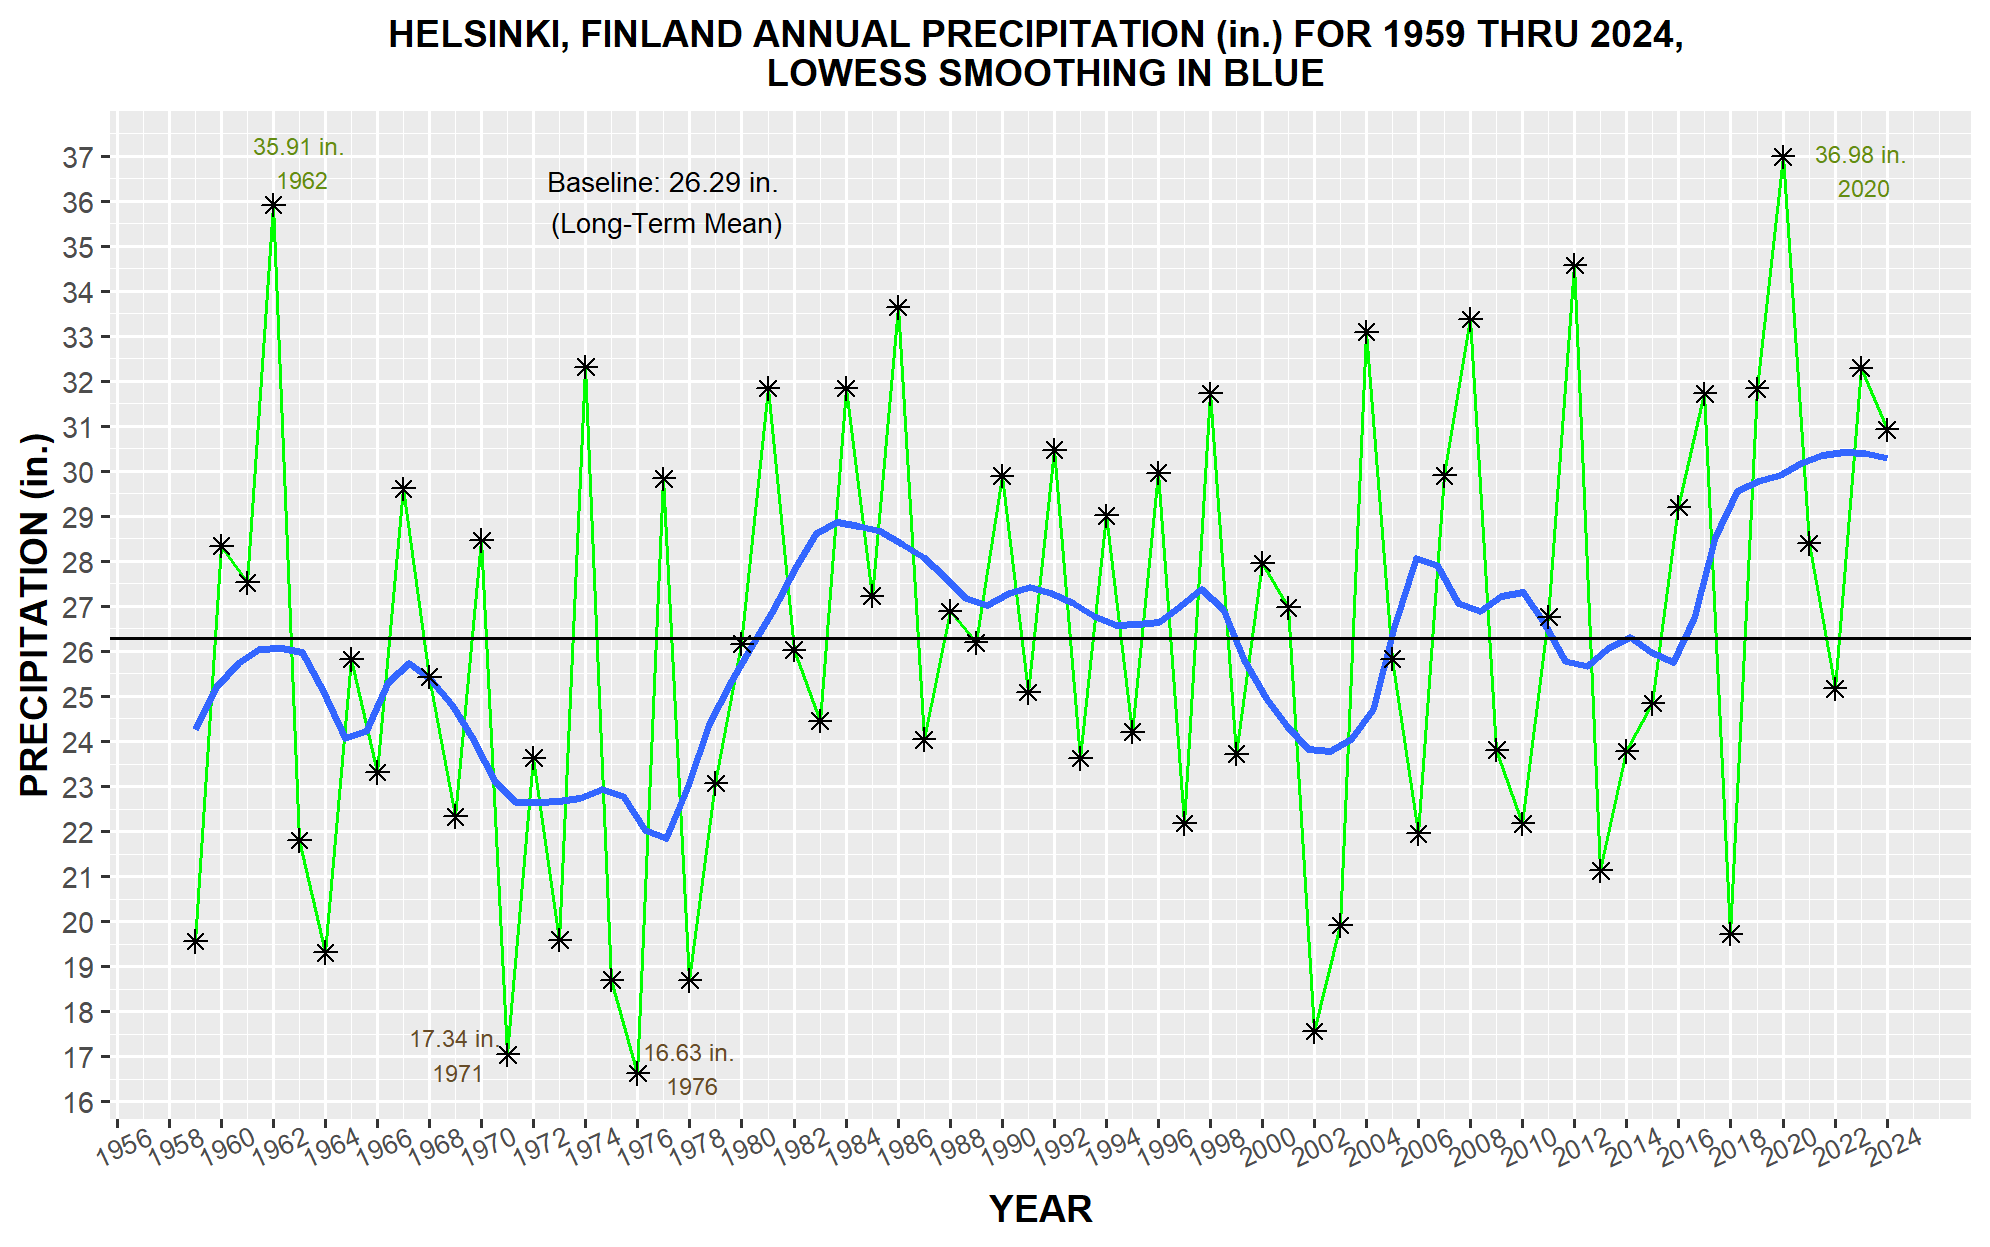
- Helsinki Annual Precipitation History (1959-2024) New (3/4/2025)
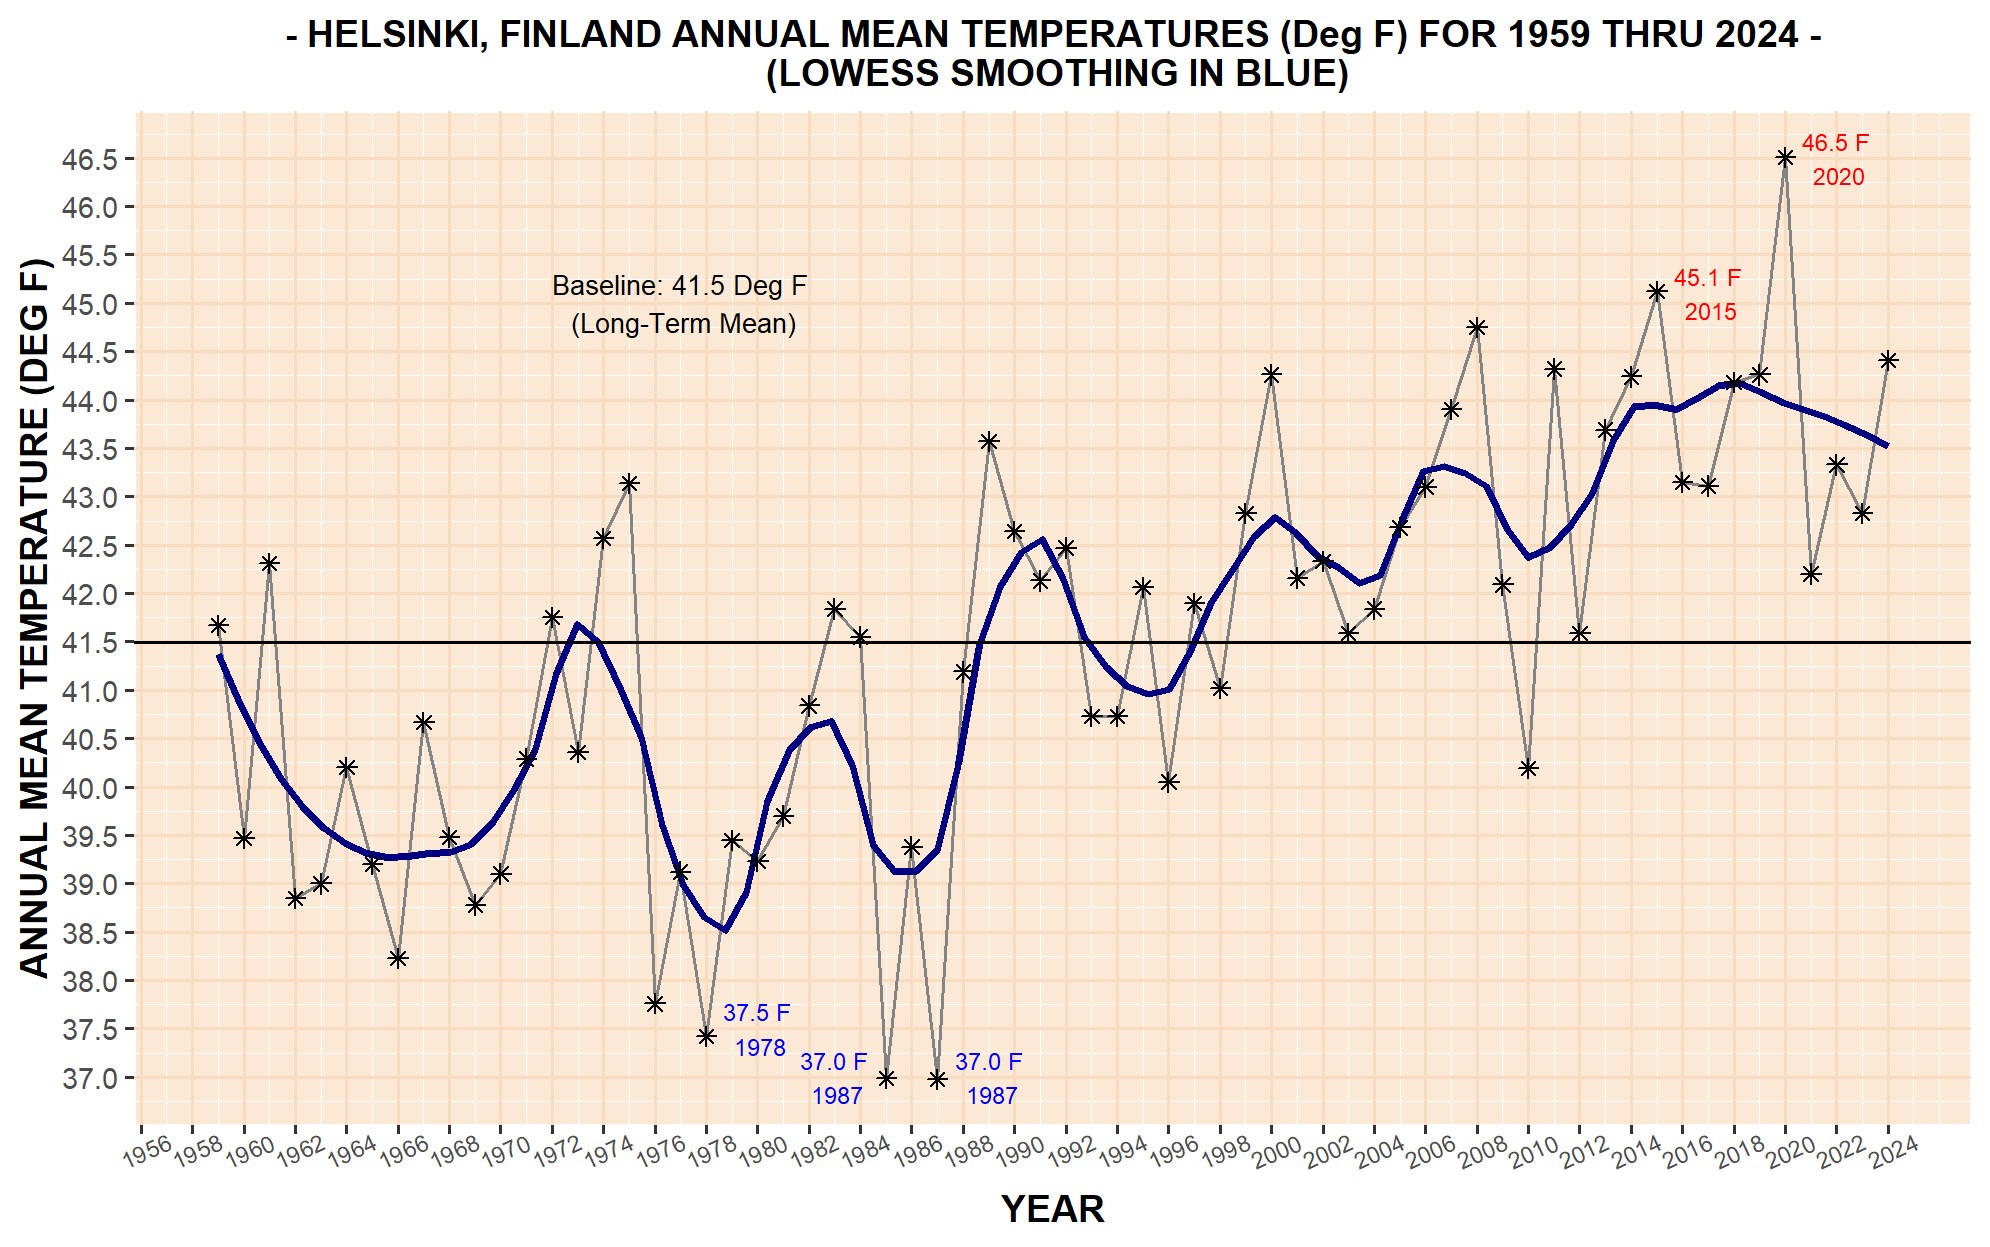
- Helsinki Annual Mean Temperature History (1959-2024) New(3/4/2025)
- Helsinki # of Days with Snowcover, by Season
- Helsinki # of Days with 12″ or greater Snowcover, by Season
- Helsinki Temps at One-Third Month Intervals
- Helsinki Mean Monthly Precipitation
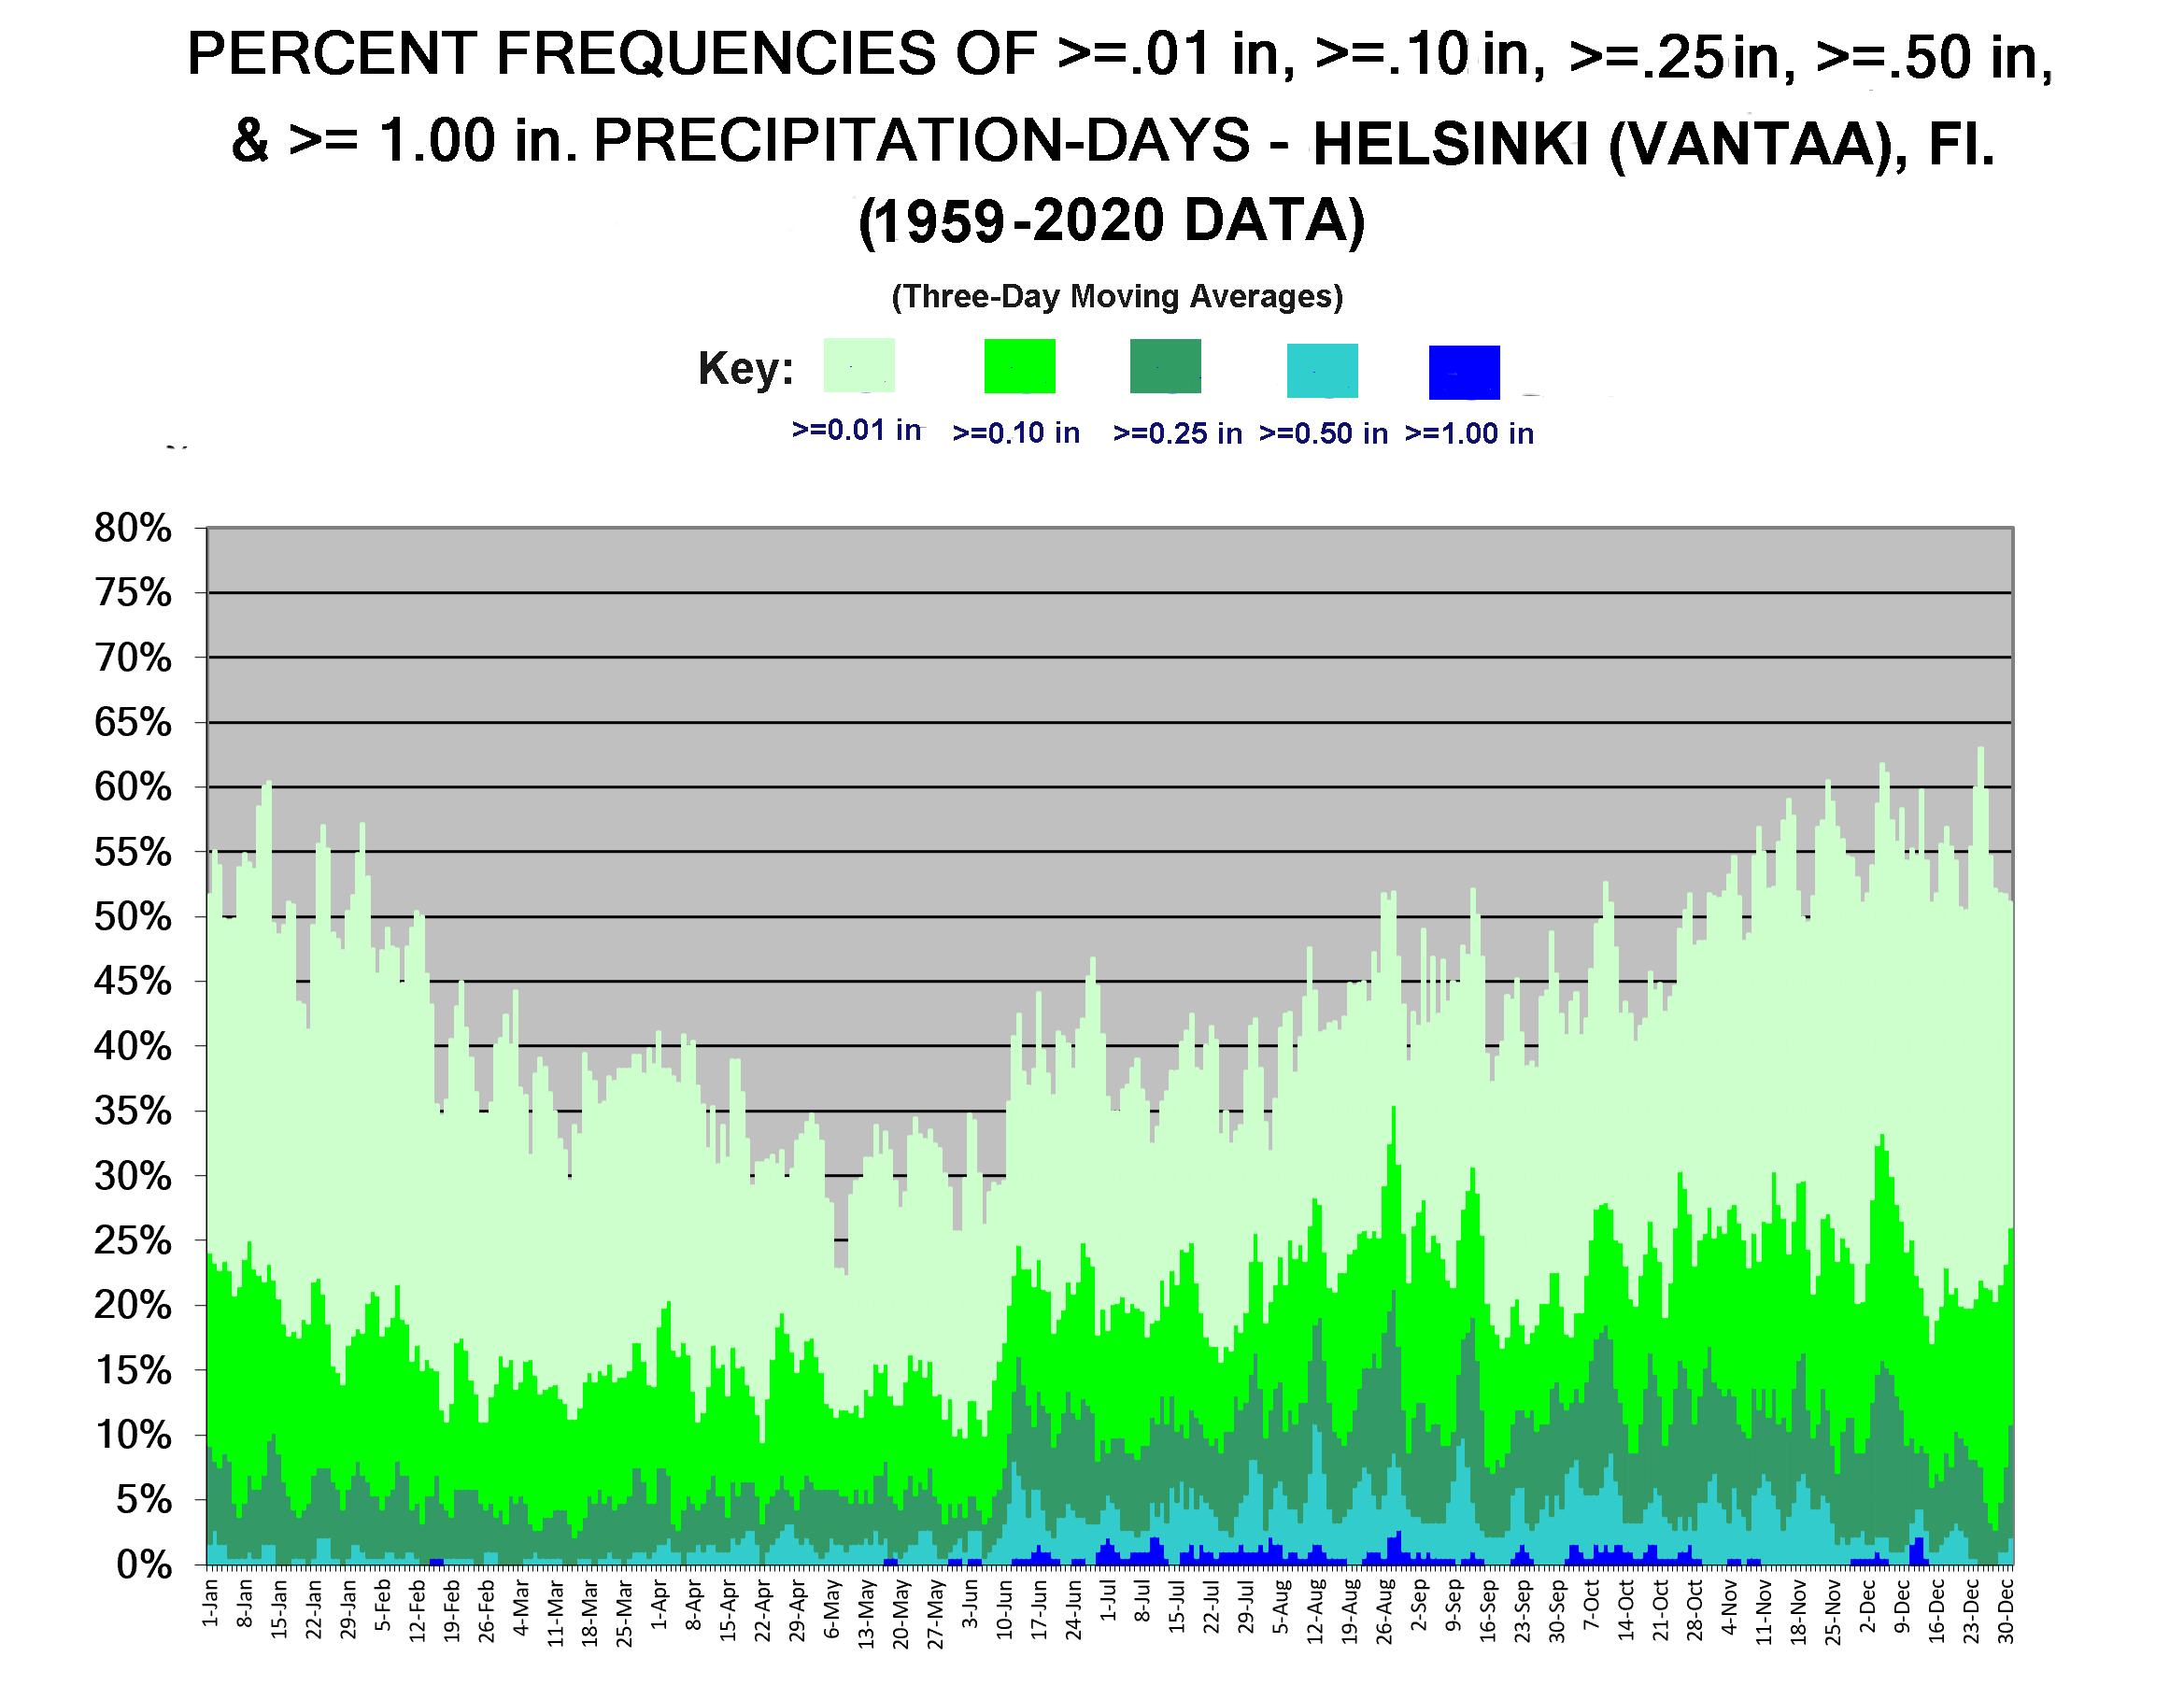
- Helsinki Pct. Frequencies of >=0.01 in., >=0.10 in., >= 0.25 in, >=0.50 and >=1.00 in. Rainfall Days, by Calendar Day (1959-2020)
- Helsinki Mean Daily Temperature Range, by Calendar Day
HOUR-BY-MONTH CLIMOGRAMS FOR HELSINKI
- Mean & Extreme Hourly Temps (Upper 99th & and Lower 1st Percentile Levels)
- Mean Hourly Rel Hum’s
- Lowermost 1st percentile (dry) Rel Hum’s
- Mean Vector Wind Directions, Speeds, and Constancies
- Prevailing 8-Point Compass Wind Directions, Frequencies, and Mean Speeds
- Mean Scalar Wind Speeds
- Extreme Highest Sustained Winds (99% Percentile Level)
- Cloud Ceilings
- Fog
- Thunderstorms
YEAR-TO-YEAR GRAPHS – INTERPRETATION
The uppermost chart for a given year’s page, accessed by the links below, are “floating-bars” of the year’s daily maxima and minima temperatures (in deg F). The bars depict the varying diurnal, synoptic, long-wave, and seasonal temperature anomaly influences on Helsinki temperature over the course of the year.
The second chart down shows the day-to-day mean temperature anomalies (daily mean temperature less the corresponding long-term 1959-2020 climatological mean), and the third one, the anomalies in deseasonalized or standardized form (z-scores). Greatest positive standardized departure in the 1959-2020 Helsinki record is +3.20 z for 8 Aug 2010, greatest negative –4.34 z for 17 Apr 1966.
The fourth chart down depicts daily precipitation totals, as high as 2.58 inches (9 Jul 1996), the the fifth, daily snowdepths, as high as 34.6″ on five different days in February 1966.
Note: clicking on the yearly floating-bar charts a second time after they appear on the screen will enlarge them even further.
YEAR-TO-YEAR GRAPHS – COMPLETE SET OF LINKS
1959 1960 1961 1962 1963 1964 1965 1966 1967 1968 1969 1970 1971 1972 1973 1974 1975 1976 1977 1978 1979 1980 1981 1982 1983 1984 1985 1986 1987 1988 1989 1990 1991 1992 1993 1994 1995 1996 1997 1998 1999 2000 2001 2002 2003 2004 2005 2006 2007 2008 2009 2010 2011 2012 2013 2014 2015 2016 2017 2018 2019 2020
SELECTED YEARS’ WITH SOME OF THE MORE INTERESTING PATTERNS
2020 – Warmest AND Wettest Year in history – ’19-’20 Snow Season also the lightest in history.
2015 – Warmest Year to date (45.1 F). No subzero temperatures all year (lowest +2 F).
2014 – Gyrating temperature anomaly spells, both warm and cold over first half of year.
2011 – Another snowy (’10-’11) winter. Cold February, but warmest Summer AND Fall to date.
2010 – Snowiest 2009-2010 winter season since 1969-1970, but warmest calendar month (July) of history (72.7 F); also warmest Summer to date; 93 F on 28 July. Max/Min on 8 August: 89 F/71 F).
2008 – Warmest Year to date (44.7 F). January and February each warmer than March.
2006 – Driest Summer (June-August: 2.76″ precipitation).
2002 – Persistent well above average daily temperatures thru early September, abrupt shift to colder than average thru year-end.
2000 – Warmest year to date (44.2 F).
1994 – First 90 F + of post-1959 period, on 27-July.
1989 – Mildest January to March period on record (32.8 F), and warmest year of at least the last 30 – (43.5 F). Commences warming trend in annual mean temperatures: 26 of next 32 years including ’89 warmer than 1959-2020 mean (41.4 F).
1987 – Historic cold spell in January. Temperatures no higher than -12 F over the 5th to 12th, -20 F over the 9th to 12th. Daily mean departures as great as -51 F. Monthly mean only 0.5 F – Coldest calendar month in history, post-1959.
1985 – Very Cold January & February. Coldest Year of 1959-present period (36.8 F).
1978 – Intense cold closes the year. Coldest December of 1959-present period (9.0 F) and coldest year thus far overall (37.3 F).
1976 – Driest Year (16.63″) of 1959- Present period.
1974 – Record Wet Fall (Sep.-Nov. – 14.66″). No subzero temperatures during the year (minimum: + 6 F).
1973 – Cold spells, progressively more anomalous, from mid-August on.
1966 – Long cold winter. Continuous snow cover from 17 Nov ’65 thru 30 Apr ’66. Temperature drops to 3 F on 17 April; ’65-’66 snow season the heaviest in history.
1965 – Pronounced cold spells, usually several weeks’ duration, throughout the year.